Simulation diagrams. UML: from theory to practice
Read also
The UML is graphic language general-purpose modeling tool for specification, visualization, design and documentation of all artifacts created during development software systems.
There are many good books that describe in detail about UML (sometimes even very detailed), I would like to collect in one place the basic concepts about diagrams, entities and relationships between them for quick recall, something like a cheat sheet.
The note uses materials from books: Ivanov D. Yu., Novikov F. A. Unified modeling language UML And Leonenkov. UML Tutorial.
Let's start with the editor. Under Linux, I tried different UML editors, most of all I liked UMLet, although it is written in Java, it moves very quickly and most of the entity blanks are in it. There is also ArgoUML, a cross-platform UML editor, also written in Java, functionally rich, but slowing down more.
I stopped at UMLet, install it under Arch Linux And ubuntu:
# under Arch Linux yaourt -S umlet # under Ubuntu sudo apt-get install umlet
In UML, all entities can be broken down into the following types:
- structural;
- behavioral;
- grouping;
- annotational;
The UML uses four main types of relationships:
Dependency- indicates that changing the independent entity affects the dependent entity in some way. Graphically, a dependency relationship is depicted as a dotted line with an arrow pointing from the dependent entity to the independent entity.
Association- takes place if one entity is directly related to another (or to others - the association can be not only binary). Graphically, an association is depicted as a solid line with various additions connecting related entities.
Generalization is a relationship between two entities, one of which is a particular (specialized) case of the other. Graphically, generalization is depicted as a line with a triangular unfilled arrow at the end, directed from the particular (subclass) to the general (superclass).
Implementations- the implementation relation indicates that one entity is an implementation of another. Graphically, the implementation is depicted as a dotted line with a triangular unfilled arrow at the end, directed from the implementing entity to the implemented one.
IN UML 2 defined 13 chart types. By standards, each chart should have a border with a rectangle (lower right corner beveled) in the left upper corner, which specifies the chart ID (tag) and title.
Diagrams to depict the structure of the system:
- Component diagram (component diagram, tag component);
- Deployment diagram (deployment diagram, tag deployment);
- Class diagram (class diagram, tag class);
- Object diagram (object diagram, tag object);
- Internal structure diagram (composite structure diagram, tag class);
Diagrams to depict system behavior:
- Synchronization diagram (interaction diagram, tag timing);
- Activity diagram (activity diagram, tag activity);
- sequence diagram (sequence diagram, tag sd);
- Communication diagram (communication diagram, tag comm);
- Automaton diagram (state machine diagram, tag state machine);
- Interaction overview diagram, tag interaction);
The charts stand out:
- Use case diagram (use case diagram, use case tag);
- Package diagram (package diagram, tag package);
Usage diagram
Usage diagram(use case diagram) is the most general representation of the functional purpose of the system.

Considering a use case diagram as a model of a system, one can associate it with a black box model. Each use case defines a sequence of actions that must be performed by the designed system when it interacts with the corresponding actor.
The use diagram uses two types of basic entities: use cases and actors, between which the following basic types of relationships are established.
association relation- This relationship establishes what specific role an actor plays when interacting with an instance of a use case. An association relationship is indicated by a solid line between the actor and the use case. This line may have additional conventions, such as name and multiplicity.

Extension relation- defines the relationship of instances of a single use case with a more general use case, whose properties are determined based on the way these instances are combined together. Thus, if there is an extension relationship from use case A to use case B, then this means that the properties of an instance of use case B can be supplemented due to the presence of properties in extended use case A.
An extension relationship between use cases is indicated by a dashed line with an arrow (dependency relationship case) pointing away from the use case that is an extension of the original use case.
Generalization relation serves to indicate the fact that some use case A can be generalized to use case B. In this case, use case A will be a specialization of use case B. In this case, B is called an ancestor or parent of A, and use A is a descendant of use case B use of V.
Graphically, this relationship is represented by a solid line with an open triangle arrow that points to the parent use case.
A generalization relationship between use cases is used when it is necessary to note that child use cases have all the attributes and behaviors of parent use cases.
Inclusion relation between two use cases indicates that some specified behavior for one use case is included as a component in the behavior sequence of another use case.
An inclusion relationship, from use case A to use case B, indicates that each instance of use case A includes the functional properties specified for use case B.
Graphically, this relationship is represented by a dotted line with an arrow (dependency relationship variant) pointing from the base use case to the included use case.
class diagram
class diagram(class diagram) - the main way to describe the static structure of the system.

The class diagram uses one main type of entities: classes (including numerous special cases of classes: interfaces, primitive types, association classes, etc.), between which the following main types of relationships are established: dependencies, associations, generalizations, implementations.
Dependency relationship generally indicates some semantic relationship between two model elements or two sets of such elements that is not an association, generalization, or implementation relationship. A dependency relationship is used in a situation where some change in one model element may require a change in another dependent model element.
A dependency relationship is graphically represented by a dashed line between corresponding elements with an arrow at one end, with the arrow pointing from the dependency's client class to the independent or source class.

Above the arrow there may be special keywords(stereotypes):
- "access" - serves to indicate the availability of public attributes and operations of the source class for client classes;
- "bind" - the client class can use some template for its subsequent parameterization;
- "derive" - attributes of the client class can be calculated from the attributes of the source class;
- "import" - public attributes and operations of the source class become part of the client class, as if they were declared directly in it;
- "refine" - indicates that the client class serves as a refinement of the source class for historical reasons, when Additional Information during the course of the project.
association relation corresponds to the presence of some relationship between classes. This relationship is indicated by a solid line with additional special symbols that characterize individual properties of a particular association. As additional special characters the name of the association may be used, as well as the names and multiplicity of the association's role classes. The name of an association is an optional element of its designation.

Aggregation relation occurs between several classes if one of the classes is an entity that includes other entities as components. It is used to represent system relationships of the "part-whole" type.

Composition relation is a special case of an aggregation relation. This relationship serves to highlight a special form of the part-whole relationship in which the constituent parts are in some sense within the whole. The specificity of the relationship between them lies in the fact that the parts cannot act in isolation from the whole, i.e., with the destruction of the whole, all its constituent parts are also destroyed.

Generalization relation is a relation between a more general element (parent or ancestor) and a more specific or special element(child or descendant). As applied to a class diagram, this relationship describes the hierarchical structure of classes and the inheritance of their properties and behavior. This assumes that the descendant class has all the properties and behavior of the ancestor class, and also has its own properties and behavior that are not present in the ancestor class.

automaton diagram
automaton diagram(state machine diagram) or state diagram in UML 1 (state chart diagram) is one way to describe behavior in detail in UML. In essence, automaton diagrams, as the name implies, are a graph of states and transitions. state machine loaded with many additional details and details.
The state diagram describes the process of changing the states of only one class, or rather, one instance of a certain class, that is, it models all possible changes in the state of a particular object. In this case, a change in the state of an object can be caused by external influences from other objects or from the outside. It is to describe the reaction of an object to such external influences that state diagrams are used.

In the automaton diagram, one main type of entity is used - states, and one type of relationship - transitions, but for both of them there are many varieties, special cases and additional designations. The automaton represents the dynamic aspects of the simulated system in the form of a directed graph, the vertices of which correspond to states, and the arcs correspond to transitions.
Initial state represents special case state that contains no domestic action(pseudo-states). The object is in this state by default at the initial moment of time. It serves to indicate on the state diagram of the graphical area from which the process of changing states begins.
Final (final) a state is a special case of a state that also does not contain any internal actions (pseudo-states). The object will be in this state by default after the completion of the automaton at the end time.

activity diagram
When modeling the behavior of a system being designed or analyzed, it becomes necessary not only to present the process of changing its states, but also to detail the features of the algorithmic and logical implementation of the operations performed by the system.
activity diagram(activity diagram) is another way of describing behavior that visually resembles a good old flowchart of an algorithm. Used to simulate the process of performing operations.
The main direction of using activity diagrams is to visualize the features of the implementation of class operations, when it is necessary to present algorithms for their execution.

In the activity diagram, one main type of entities is used - action, and one type of relationship - transitions (transfers of control). Also used are such constructions as forks, mergers, connections, branchings. Recommended as a name simple action use a verb with explanatory words.
sequence diagram
sequence diagram(sequence diagram) is a way of describing the behavior of the system "by examples".
In fact, a sequence diagram is a record of the protocol of a particular session of the system (or a fragment of such a protocol). In object-oriented programming, the most essential thing at runtime is the passing of messages between cooperating objects. It is the sequence of sending messages that is displayed on this diagram, hence the name.

In the sequence diagram, one main type of entities is used - instances of interacting classifiers (mainly classes, components and actors), and one type of relationship - links through which messages are exchanged.
Possible types of messages (image taken from larin.in):

Communication Diagram
Communication Diagram(communication diagram) - a way of describing behavior, semantically equivalent to a sequence diagram. In fact, this is the same description of the message exchange sequence of interacting instances of classifiers, only expressed by other graphic means.

Thus, in the communication diagram, as well as in the sequence diagram, one main type of entities is used - instances of interacting classifiers and one type of relationship - connections. However, here the emphasis is not on time, but on the structure of relationships between specific instances.
Component Diagram
Component Diagram(component diagram) - shows the relationship between the modules (logical or physical) that make up the simulated system.

The main entity type in a component diagram is the components themselves, as well as interfaces, through which the relationship between components is indicated. The following relationships apply in the component diagram:
- implementations between components and interfaces (the component implements the interface);
- dependencies between components and interfaces (a component uses an interface);
Placement diagram
Placement diagram(deployment diagram), along with displaying the composition and relationships of system elements, shows how they are physically placed on computing resources during execution.

In the placement diagram, compared to the component diagram, two types of entities are added: an artifact, which is an implementation of the component and a node (it can be either a classifier that describes the type of node or a specific instance), as well as an association relationship between nodes, showing that the nodes physically connected at run time.
Object Diagram
Object Diagram(object diagram) - is an instance of a class diagram.

In the object diagram, one main type of entities is used: objects (class instances), between which specific relationships are indicated (most often association instances). Object diagrams are of an auxiliary nature - in fact, these are examples (one might say, memory dumps) that show what objects exist and the relationships between them at some particular moment in the system's operation.
Diagram of internal structure(composite structure diagram) is used for a more detailed presentation of structural classifiers, primarily classes and components.
A structural classifier is shown as a rectangle with the name of the classifier at the top. Inside are parts. There may be several parts. Parts can interact with each other. This is indicated by connectors of various kinds. The place on the outer edge of the part to which the connector is attached is called the port. Ports are also located on the outer boundary of the structural classifier.
Interaction Overview Diagram(interaction overview diagram) is a kind of activity diagram with an extended syntax: as elements of an overview interaction diagram, links to interactions (interaction use) defined by sequence diagrams can act.
Timing chart
Timing chart(timing diagram) is a special form of a sequence diagram, in which special attention is paid to the change in the states of various instances of classifiers and their time synchronization.
Package diagram
Package diagram(package diagram) is the only tool that allows you to manage the complexity of the model itself.

The main elements of the notation are packages and dependencies with various stereotypes.
Entity-relationship model (ER-model)
analogue class diagrams(UML) can be ER model, which is used in the design of databases (relational model).
Entity-relationship model (ER-model) is a data model that allows you to describe the conceptual schemas of the subject area. The ER model is used in high-level (conceptual) database design. With its help, you can highlight the key entities and designate the relationships that can be established between these entities. wikipedia
Any fragment of the subject area can be represented as a set of entities, between which there are some set of relationships.
Basic concepts:
Essence(entity) is an entity that can be identified in some way that distinguishes it from other entities, for example, CLIENT 777. An entity is actually a set of attributes.
Entity set(entity set) - a set of entities of the same type (having the same properties).
Connection(relationship) is an association established between multiple entities.
Domain(domain) - set of values (domain) of the attribute.
There are three types of binary links:
- one to one- a single instance of an entity of one class is associated with a single instance of an entity of another class, for example, HEAD - DEPARTMENT;
- 1 to N or one to many- a single instance of an entity of one class is associated with many instances of an entity of another class, for example, DEPARTMENT - EMPLOYEE;
- N to M or many to many- many instances of an entity of one class are associated with many instances of an entity of another class, for example, EMPLOYEE - PROJECT; Glossary of basic concepts in UML
- Fowler M. UML. Fundamentals, 3rd Edition
- Butch G., Rambo D., Jacobson I. UML language. User guide
object- an entity that has a uniqueness and encapsulates the state and behavior.
class- a description of a set of objects with common attributes defining state and operations defining behavior.
interface- a named set of operations that defines a set of services that can be requested by the consumer and provided by the service provider.
Cooperation- a set of objects that interact to achieve some goal.
Actor- an entity that is outside the modeled system and directly interacts with it.
component- a modular part of the system with a well-defined set of required and provided interfaces.
Artifact- an element of information that is used or generated during the development process software. In other words, an artifact is a physical unit of implementation derived from a model element (such as a class or component).
Node- a computing resource on which artifacts are placed and, if necessary, executed.
Behavioral entities are intended to describe behavior. There are only two basic behavioral entities: state and action.
state- a period in the life cycle of an object, being in which the object satisfies a certain condition and performs its own activity or waits for the occurrence of some event.
action- primitive atomic calculation.
Machine is a package that defines a set of concepts necessary to represent the behavior of the modeled entity as a discrete space with a finite number of states and transitions.
classifier is a descriptor for a set of objects of the same type.
Extra reading
UML is now the standard notation for visual modeling of software systems, adopted by the Object Managing Group (OMG) in the fall of 1997 and supported by many object-oriented CASE products.
The UML standard offers the following set of diagrams for modeling:
Use case diagram (use case diagram) - for modeling the business processes of an organization or enterprise and determining the requirements for the information system being created;
class diagram (class diagram) - for modeling the static structure of the system classes and the relationships between them;
system behavior diagram (behavior diagrams);
interaction diagrams;
Sequence diagrams - for modeling the process of messaging between objects within one use case;
collaboration diagram (collaboration diagram) - for modeling the process of messaging between objects within the same use case;
statechart diagram - for modeling the behavior of system objects during the transition from one state to another;
activity diagram - for modeling the behavior of the system within the framework of various use cases, or modeling activities;
implementation diagram (implementation diagrams):
Component diagrams (component diagrams) - for modeling the hierarchy of components (subsystems) of an information system;
deployment diagram (deployment diagram) - for modeling the physical architecture of the designed information system.
On fig. 1.1 presents an integrated model of the information system, including the main diagrams to be developed in this course project.
Rice. 1. An integrated model of an information system in the notation of the UML language
4.2. Use case diagram
A use case is a sequence of actions performed by the system in response to an event triggered by some external object (actor). A use case describes a typical interaction between a user and a system. In the simplest case, the use case is determined in the process of discussing with the user the functions that he would like to implement in this information system. In UML, a use case is depicted as follows:

Fig.2. Use Case
An actor is a role that a user plays in relation to the system. Actors represent roles, not specific people or job titles. Although they are depicted as stylized human figures in use case diagrams, an actor can also be external. information system, which needs some information from the given system. You should only show actors in a diagram when they really need some use cases. In UML, actors are represented as shapes:
Fig.3. Character (actor)
Actors are divided into three main types:
Users
systems;
Other systems interacting with this one;
Time becomes an actor if the triggering of any events in the system depends on it.
4.2.1. Relationships Between Use Cases and Actors
In UML, use case diagrams support several types of relationships between diagram elements:
Communication (communication),
Inclusion (include),
extension (extend),
generalization.
communication communication is the relationship between the use case and the actor. In UML, communication links are shown using a one-way association (solid line).

Fig.4. Communication link example
Inclusion connection used in situations where there is some piece of system behavior that is repeated in more than one use case. With the help of such links, a reusable function is usually modeled.
Extension connection used to describe changes in the normal behavior of a system. It allows one use case to optionally use functionality another use case.

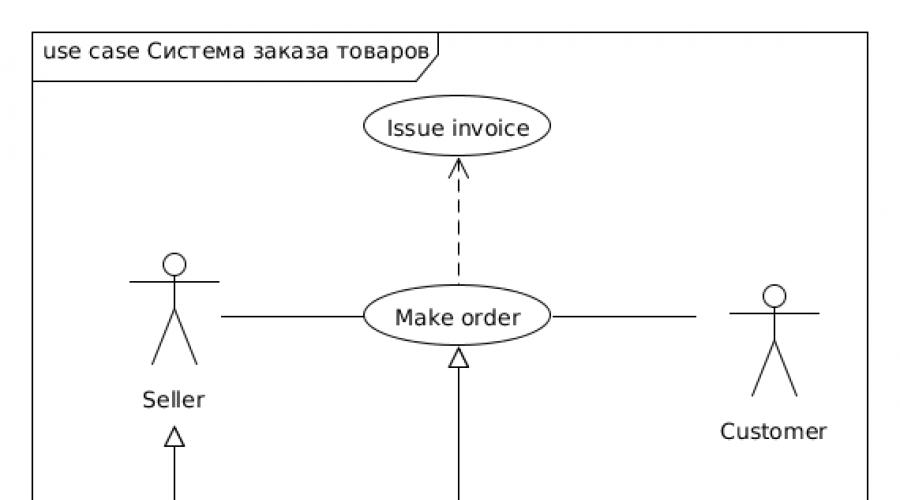
Fig.5. An example of an inclusion and extension relationship
Communication generalization indicates that several actors or classes have common properties.

Fig.6. An example of a generalization relationship
4.3.
Interaction diagrams describe the behavior of interacting groups of objects. Typically, an interaction diagram only covers the behavior of objects within a single use case. Such a diagram displays a number of objects and the messages that they exchange with each other.
message is the means by which the sender object requests the receiver object to perform one of its operations.
Information (informative) message is a message that provides the receiving object with some information to update its state.
Request message (interrogative) is a message requesting the output of some information about the recipient object.
Imperative message is a message that asks the receiver to perform some action.
There are two types of interaction diagrams: sequence diagrams and collaboration diagrams.
4.3.1. Sequence diagrams
sequence diagram reflects the flow of events occurring within a single use case.
All actors (actors, classes, or objects) involved in a given scenario (use case) are shown at the top of the diagram. Arrows correspond to messages passed between an actor and an object, or between objects to perform the required functions.
In a sequence diagram, an object is depicted as a rectangle, from which a dotted line is drawn down. vertical line. This line is called lifeline of an object . It is a fragment of the life cycle of an object in the process of interaction.
Each message is represented as an arrow between the lifelines of two objects. Messages appear in the order they appear on the page from top to bottom. Each message is tagged with at least the message name. Optionally, you can also add arguments and some control information. You can show self-delegation, a message that an object sends to itself, with the message arrow pointing to the same lifeline.

Rice. 7. Sequence Diagram Example
4.3.2. Collaboration diagram
Cooperation Diagrams display the flow of events within a specific scenario (use case). Messages are ordered by time, although collaboration diagrams focus more on relationships between objects. A collaboration diagram shows all the information that a sequence diagram has, but a collaboration diagram describes the flow of events in a different way. From it it is easier to understand the connections that exist between objects.
In a collaboration diagram, just like in a sequence diagram, the arrows represent the messages that are exchanged within the framework. this option use. Their time sequence is indicated by numbering the messages.

Rice. 8. An example of a cooperation diagram
4.4. class diagram
4.4.1. General information
class diagram defines the types of system classes and various kinds of static links that exist between them. Class diagrams also show class attributes, class operations, and constraints that are placed on relationships between classes.
A class diagram in UML is a graph whose nodes are the elements of the static structure of the project (classes, interfaces), and the arcs are the relationships between the nodes (associations, inheritance, dependencies).
The class diagram shows the following elements:
· Package (package) - a set of elements of the model, logically related to each other;
· Class (class) - description of common properties of a group of similar objects;
· Interface (interface) - an abstract class that specifies a set of operations that an object of an arbitrary class associated with a given interface provides to other objects.
4.4.2. Class
Class is a group of entities (objects) that have similar properties, namely data and behavior. An individual member of a class is called an object of the class, or simply an object.
The behavior of an object in UML refers to any rules for the interaction of an object with the outside world and with the data of the object itself.
In diagrams, a class is depicted as a rectangle with a solid border, divided by horizontal lines into 3 sections:
The top section (the name section) contains the name of the class and other general properties (in particular, the stereotype).
The middle section contains a list of attributes
At the bottom is a list of class operations that reflect its behavior (actions performed by the class).
Any of the attribute and operation sections may not be shown (or both). For the missing section, you do not need to draw a dividing line and somehow indicate the presence or absence of elements in it.
Additional sections, such as Exceptions, may be introduced at the discretion of a particular implementation.

Rice. 9. Class Diagram Example
4.4.2.1.Class stereotypes
Class stereotyping is a mechanism for classifying classes into categories.
The UML defines three main class stereotypes:
Boundary (border);
Entity (entity);
Control (management).
4.4.2.2.Boundary classes
Boundary classes are those classes that are located on the boundary of the system and the entire environment. These are displays, reports, interfaces with hardware (such as printers or scanners), and interfaces with other systems.
To find boundary classes, you need to explore use case diagrams. Every interaction between an actor and a use case must have at least one boundary class. It is this class that allows the actor to interact with the system.
4.4.2.3.Entity classes
Entity classes contain stored information. They have the greatest meaning for the user, and therefore their names often use terms from the subject area. Usually, for each entity class, a table is created in the database.
4.4.2.4.Control classes
Control classes are responsible for coordinating the actions of other classes. Typically, each use case has one control class that controls the sequence of events for that use case. The control class is responsible for coordination, but does not carry any functionality in itself, since the other classes do not send it a large number messages. Instead, he himself sends a lot of messages. The manager class simply delegates responsibility to other classes, which is why it is often referred to as the manager class.
There may be other control classes in the system that are common to several use cases. For example, there might be a SecurityManager class responsible for monitoring security-related events. The TransactionManager class handles the coordination of messages related to database transactions. There may be other managers to deal with other elements of the system's operation, such as resource sharing, distributed data processing, or error handling.
In addition to the stereotypes mentioned above, you can create your own.
4.4.2.5.Attributes
An attribute is a piece of information associated with a class. Attributes store encapsulated class data.
Because the attributes are contained within the class, they are hidden from other classes. Because of this, it may be necessary to specify which classes have the right to read and modify attributes. This property is called attribute visibility.
The attribute can have four possible values for this parameter:
Public (general, open). This visibility value assumes that the attribute will be visible to all other classes. Any class can view or change the value of an attribute. In accordance with UML notation, a common attribute is preceded by a "+" sign.
Private (closed, secret). The corresponding attribute is not visible to any other class. A private attribute is denoted by a "-" sign in accordance with UML notation.
Protected (protected). Such an attribute is available only to the class itself and its descendants. The UML notation for a protected attribute is the "#" character.
Package or Implementation (batch). Assume that the given attribute is shared, but only within its package. This type of visibility is not indicated by any special icon.
With the help of closedness or security, it is possible to avoid the situation when the attribute value is changed by all classes of the system. Instead, the attribute modification logic will be wrapped in the same class as the attribute itself. The visibility options you set will affect the generated code.
4.4.2.6.Operations
Operations implement class-related behavior. An operation has three parts - a name, parameters, and a return type.
Parameters are the arguments that the operation receives as input. The return type refers to the result of the action of the operation.
A class diagram can show both the names of operations and the names of operations along with their parameters and return type. To reduce the load on the diagram, it is useful to show only the names of operations on some of them, and their full signature on others.
In UML, operations have the following notation:
Operation Name (argument: argument data type, argument2: argument2 data type,...): return type
There are four different types of operations to consider:
Implementation operations;
Management operations;
Access operations;
Auxiliary operations.
Implementation operations
Implementor operations implement some business functions. Such operations can be found by examining interaction diagrams. Diagrams of this type focus on business functions, and each message in the diagram can most likely be associated with an implementation operation.
Each implementation operation must be easily traceable to the corresponding requirement. This is achieved at various stages of the simulation. The operation is derived from the message in the interaction diagram, the messages come from detailed description a flow of events that is created based on the use case, and the latter is based on the requirements. Being able to trace this entire chain helps ensure that each requirement is implemented in the code, and each piece of code implements some requirement.
Management operations
Manager operations manage the creation and destruction of objects. Class constructors and destructors fall into this category.
Access operations
Attributes are usually private or protected. However, other classes sometimes need to view or change their values. There are access operations for this. This approach makes it possible to safely encapsulate attributes within a class, protecting them from other classes, but still allowing them to be controlled access. Creating Get and Set operations (getting and changing a value) for each attribute of a class is a standard.
Auxiliary operations
Auxiliary (helper operations) are those operations of a class that are necessary for it to fulfill its responsibilities, but about which other classes should not know anything. These are private and protected class operations.
To identify transactions, do the following:
1. Study sequence diagrams and cooperative diagrams. Most of the messages in these diagrams are implementation operations. Reflective messages will be auxiliary operations.
2. Consider control operations. You may need to add constructors and destructors.
3. Consider access operations. For each class attribute that other classes will need to work with, you need to create Get and Set operations.
4.4.2.7.Connections
A relationship is a semantic relationship between classes. It gives a class the ability to learn about the attributes, operations, and relationships of another class. In other words, in order for one class to send a message to another in a sequence or cooperative diagram, there must be a connection between them.
There are four types of relationships that can be established between classes: associations, dependencies, aggregations, and generalizations.
Communication association
An association is a semantic relationship between classes. They are drawn on the class diagram as an ordinary line.

Rice. 10. Communication association
Associations can be bidirectional, as in the example, or unidirectional. In the UML, bidirectional associations are drawn as a simple line with no arrows, or with arrows on both sides of the line. A unidirectional association has only one arrow showing its direction.
The direction of an association can be determined by examining sequence diagrams and cooperative diagrams. If all messages on them are sent by only one class and received only by another class, but not vice versa, there is a unidirectional communication between these classes. If at least one message is sent in the opposite direction, the association must be bidirectional.
Associations can be reflexive. Reflexive association means that one instance of a class interacts with other instances of the same class.
Communication addiction
Dependency relationships also reflect the relationship between classes, but they are always unidirectional and show that one class depends on definitions made in another. For example, class A uses methods of class B. Then, when class B changes, it is necessary to make corresponding changes in class A.
A dependency is represented by a dotted line drawn between two diagram elements, and the element anchored at the end of an arrow is said to be dependent on the element anchored at the beginning of that arrow.

Rice. 11. Communication addiction
When generating code for these classes, no new attributes will be added to them. However, the language-specific operators needed to support communication will be created.
Communication aggregation
Aggregations are a tighter form of association. Aggregation is the connection between the whole and its part. For example, you might have a Car class, as well as Engine, Tire classes, and classes for other car parts. As a result, an object of class Car will consist of an object of class Engine, four objects of Tires, etc. Aggregations are visualized as a line with a rhombus for a class that is an integer:

Rice. 11. Communication aggregation
In addition to simple aggregation, the UML introduces a stronger form of aggregation called composition. According to composition, an object-part can only belong to a single whole, and, in addition, as a rule, life cycle parts coincides with the cycle of the whole: they live and die with it. Any removal of the whole extends to its parts.
This cascading deletion is often considered part of the definition of aggregation, but it is always implied when the role multiplicity is 1..1; for example, if a Customer needs to be deleted, then that deletion must be propagated to Orders (and, in turn, Order Lines).
UML or Unified Modeling Language is a graphical description language for object modeling in the field of software development. But the use of UML is not limited to IT, another large area of practical application of UML is business process modeling, system design and mapping of organizational structures. The UML enables software developers to agree on graphical notation for presentation. general concepts and focus on design and development.
Benefits of UML
- UML uses graphical symbols for the elements of the system being modeled, and the UML diagrams are fairly easy to understand;
- UML makes it possible to describe systems from almost every possible point of view, taking into account various aspects;
- UML is object-oriented: its methods of analysis and construction are semantically close to the programming methods used in modern OOP languages;
- UML is an open standard. The standard develops and evolves from version to version, meeting the most modern requirements for describing systems;
- contains an extension mechanism that allows you to enter additional text and graphic types, which makes it possible to use UML not only in the field of IT.
Types of UML Diagrams
There are 14 diagram types in UML. They can be divided into 2 categories:
- structural representing information structure;
- behavioral, representing the behavior of the system and various aspects of interactions. A separate subspecies of behavior diagrams are interaction diagrams.
Hierarchy of UML diagram types,
represented by a class diagram
Structural diagrams
- class diagram is a key element in object-oriented modeling. With the help of this diagram (actually, through classes, their attributes, methods and dependencies between classes) describes the domain model and the structure of the modeled system.
- Component Diagram displays the division of the program code into large blocks (structural components) and shows dependencies between them. Components can be packages, modules, libraries, files, etc.
- object diagram shows a full or partial cut of the simulated system at a given point in time. It represents class instances (objects), their state ( current values attributes) and the relationship between them.
- Composite structure diagram demonstrates the internal structure of classes and, if possible, the interactions between the elements of this structure.
- Package diagram shows the packages and the relationships between them. This type of diagram serves to simplify the structure of the model (and, accordingly, work with it) by combining model elements into groups according to certain criteria.
- Deployment Diagram models deployment software components (artifacts) on computing resources/hardware components ( nodes).
- Profile diagram describes an extensibility mechanism that allows the UML to be adapted to a variety of subject areas and fields of activity.

UML Class Diagram Example
Behavior Diagrams
- activity diagram shows actions ( actions) of which some activity ( activity). Activity diagrams are used to model business processes, technological processes, serial and parallel computing.
- Use case diagram(or use case diagram) describes the relationship between actors (actors) and use cases of the simulated system (its capabilities). The main purpose of the diagram is to be a universal tool for customers, developers and end users, with the help of which it would be possible to jointly discuss the system - its capabilities and behavior.
- State diagram depicts the dynamic behavior of an entity, showing how this entity, depending on its current state, reacts to various events. In fact, this is a state diagram from the theory of atoms.
- Communication Diagram(V early versions cooperation diagram) shows the interactions between the parts of the composite structure and the roles of the collaboration. The diagram explicitly indicates the relationship between elements (objects).
- sequence diagram used to visualize the sequence of object interactions. Shows the life cycle of a given object and the interaction of actors (actors) within some use case, the sequence of messages that they exchange.
- Interaction Overview Diagram includes part of the sequence diagram and control flow construct. Helps to consider the interaction of objects from different points of view.
- Timing chart- a separate subspecies of interaction diagrams, specializing in timing. Diagrams of this type are used to study the behavior of objects over a certain period of time.
What is UML?
If you look at the pictures in search engines, it becomes clear that UML- this is something about schemes, arrows and squares. What is important is that UML translates as Unified Modeling Language. The word Unified is important here. That is, our pictures will be understood not only by us, but also by others who know UML. It turns out this is such an international language for drawing diagrams.
As Wikipedia says
UML is a graphical description language for object modeling in the fields of software development, business process modeling, systems engineering, and mapping organizational structures.The most interesting thing that not everyone thinks about or guesses about is that UML has specifications. Moreover, there is even a UML2 specification. More information about the specification can be found on the Object Management Group website. Actually, this group is engaged in the development of UML specifications. It is also interesting that UML is not limited to describing the structure of classes. There are many types of UML diagrams. A brief description of the types of UML diagrams can be seen in the same Wikipedia: UML diagrams or in Timur Batyrshinov's video Overview of UML Diagrams. UML is also widely used in describing various processes, for example here: Single sign-on using JWT. Returning to the use of UML class diagrams, it is worth noting the book Head First: Design Patterns, in which the patterns are illustrated by those same UML diagrams. It turns out that the UML is indeed being used. And it turns out that knowing and understanding its application is quite a useful skill.
Application
Let's see how you can work with this very UML from the IDE. As an IDE, take IntelliJ Idea. If use IntelliJ Idea Ultimate, then we will have the plugin installed "out of the box" UML Support". It allows you to automatically generate beautiful class diagrams. For example, through Ctrl + N or the menu item "Navigate" -> "Class" go to the class ArrayList. Now, through context menu by class name select "Diagram" -> "Show diagram popup". As a result, we get a beautiful chart:
But what if you want to draw yourself, and even there is no Ultimate version of Idea? If we are using IntelliJ Idea Community Edition, then we have no other choice. To do this, you need to understand how such a UML scheme works. First we need to install Graphviz . It is a set of graph visualization utilities. It is used by the plugin that we will use. After installation, you need to add a directory bin from the installed directory graphviz V environment variable environment PATH. After that, in IntelliJ Idea, select File -> Settings from the menu. In the "Settings" window, select the "Plugins" category, click the "Browse repositories" button and install the PlantUML integration plugin. Why is this one so good PlantUML? It uses a graph description language called " dot" and this allows it to be more versatile, because given language not only PlantUML is used. Moreover, everything that we will do below, we can do not only in the IDE, but also in online service planttext.com. After installing the PlantUML plugin, we will be able to create UML diagrams through "File" -> "New". Let's create a "UML class" diagram. During this, a template with an example is automatically generated. Let's delete its contents and create our own, armed with an article from Habr: Class Relations - from UML to code. And to understand how to depict this in the text, let's take the PlantUML manual: plantuml class-diagram . In it, at the very beginning, there is a plate with how to describe the connections:

About the connections themselves, we can still peep here: "Relationships between classes in UML. Examples". Based on these materials, let's start creating our UML diagram. Add the following content describing the two classes: @startuml class ArrayList ( ) class LinkedList ( ) @enduml To see the result in Idea, select "View" -> " Tool Windows" -> "PlantUML". We will get just two squares denoting classes. As we know, both of these classes implement the List interface. This relation of classes is called implementation (realization). An arrow with a dotted line is used to depict such a relationship. Let's draw her: interface List List< | . . ArrayList List < | . . LinkedList List - один из дочерних классов Collection . То есть он наследуется от Collection. Эта связь называется обобщением (generalization). Выглядит как стрелка с обычной непрерывной линией. Изобразим её: interface Collection Collection < | -- List Для следующего типа связи добавим в описание класса ArrayList запись о package private element array: ~ Object elementData Now we want to show that the ArrayList contains some objects. In this case, the connection type will be - aggregation(aggregation). The aggregate in this case is ArrayList , because it contains other objects. We choose aggregation because the objects in the list can live without the list: they are not integral parts of it. Their lifetime is not tied to the lifetime of the list. The unit from Latin is translated as "collected", that is, something made up of something. For example, in life, there is a pumping unit, which consists of a pump and an engine. The unit itself can be disassembled, leaving some of its components. For example, to sell or put in another unit. So it is on the list. And this is expressed in the form of an empty rhombus at the unit and a continuous line. Let's put it this way: class Object ( ) ArrayList o- Object Now we want to show that, unlike ArrayList , the LinkedList class contains Node - containers that refer to stored data. In this case, Nodes are part of the LinkedList itself and cannot live separately. Node is not directly stored content, but only contains a reference to it. For example, when we add a row to the LinkedList, we add a new Node that contains a link to that row, as well as a link to the previous and next Node . This type of connection is called composition(composition). To display a composite (one that consists of parts), a filled robic is drawn, a continuous line leads to it. Now let's write this as a text display of the link: class Node ( ) LinkedList * -- Node And now we need to learn how to display another important type of link - addiction(dependency relationship). It is used when one class uses another, while the class does not contain the used class and is not its successor. For example, LinkedList and ArrayList can create a ListIterator . Let's display this as dotted arrows: class ListIterator ListIterator< . . . ArrayList : create ListIterator < . . . LinkedList : create Выглядеть после всего это будет следующим образом:

You can detail as much as you need. All designations are listed here: "PlantUML - Class Diagram". In addition, there is nothing supernatural in drawing such a scheme, and when working on your tasks, you can quickly draw it by hand. This will develop the skills to think through the application architecture and help to identify class structure flaws early on, and not after you have already spent a day implementing the wrong model. I think that's a good reason to give it a try?)

Automation
Eat various ways automatic generation of PlantUML diagrams. For example, in ideas There is a SketchIT plugin, but it doesn't draw them correctly. For example, the implementation of interfaces is drawn incorrectly (displayed as inheritance). There are also examples online of how to build this into your project's build life cycle. Let's say for Maven there is an example using uml-java-docklet . In order to show how it is, we will use the Maven Archetype to quick creation maven project. Let's execute the command: mvn archetype:generate On the question of choosing a filter ( Choose a number or apply filter) leave default by simply pressing Enter. It will always be" maven-archetype-quickstart". We select the latest version. Next, answer the questions and complete the creation of the project:
Since Maven is not the focus of this article, answers to your questions about Maven can be found in the Maven Users Center . In the generated project, open the project description file for editing, pom.xml. We will copy the contents from the description of uml-java-docklet installing into it. The artifact used in the description could not be found in the Maven Central repository. But it worked for me with this: https://mvnrepository.com/artifact/com.chfourie/uml-java-doclet/1.0.0 . That is, in that description you just need to replace groupId With " info.leadinglight" on " com.chfourie" and put version " 1.0.0 ". After that, we can execute in the directory where the file is located pom.xml these commands are: mvn clean install and mvn javadoc:javadoc . Now, if we open the generated documentation (explorer target\site\apidocs\index.html), we will see UML diagrams. By the way, the implementation is already displayed correctly here)
Conclusion
As you can see, UML allows you to visualize the structure of your application. Also, UML is not limited to just that. With the help of UML, you can describe various processes within your company or describe the business process within which the function that you write works. It is up to you to decide how much UML is useful for you personally, but it will be useful to find the time and get to know it in more detail anyway. #Viacheslav Russian version of this post: UML diagram Java on CodeGymAll UML diagrams can be conditionally divided into two groups, the first of which is general diagrams. General diagrams are practically independent of the subject of modeling and can be used in any software project without regard to the subject area, decision area, etc.
1.5.1. Usage diagram
Usage diagram(use case diagram) is the most general representation of the functional purpose of the system.
The usage diagram is intended to answer the main modeling question: what does the system do in the outside world?
In the use diagram, two types of main entities are used: use cases 1 and actors 2, between which the following main types of relationships are established:
- association between actor and use case 3 ;
- generalization between actors 4 ;
- generalization between use cases 5 ;
- dependencies ( various types) between use cases 6 .
A usage diagram, like any other, can have comments 7 . Moreover, it is strongly recommended to do this to improve the readability of the charts.
The main elements of the notation used in the usage diagram are shown below. Detailed description given in section 2.2.
1.5.2. class diagram
class diagram(class diagram) is the main way to describe the structure of the system.
This is not surprising, since the UML is primarily an object-oriented language, and classes are the main (if not the only) building block.
On the class diagram, one main type of entities is used: classes 1 (including numerous special cases of classes: interfaces, primitive types, association classes, and many others), between which the following main types of relationships are established:
- association between classes 2 (with many additional details);
- generalization between classes 3 ;
- dependencies (of various types) between classes 4 and between classes and interfaces.
Some elements of the notation used in the class diagram are shown below. A detailed description is given in chapter 3 .
1.5.3. automaton diagram
automaton diagram(state machine diagram) is one of the ways to describe behavior in detail in the UML based on the explicit allocation of states and the description of transitions between states.
In essence, automaton diagrams, as the name implies, are a state transition graph (see Chapter 4), loaded with many additional details and details.
In the automaton diagram, one main type of entities is used - states 1 , and one type of relations - transitions 2 , but for both of them a lot of varieties, special cases and additional designations are defined. To list them all in an introductory review does not make sense.
A detailed description of all variations of automaton diagrams is given in section 4.2, and the following figure shows only the main elements of the notation used on the automaton diagram.
1.5.4. activity diagram
activity diagram(activity diagram) - a way to describe behavior based on the indication of control flows and data flows.
An activity diagram is another way of describing behavior that visually resembles a good old flowchart. However, due to the modernized notation, consistent with the object-oriented approach, and most importantly, due to the new semantic component (free interpretation of Petri nets), the UML activity diagram is a powerful tool for describing the behavior of the system.
In the activity diagram, one main type of entities is used - action 1 , and one type of relationship - transitions 2 (transfers of control and data). Also used are such constructions as forks, mergers, connections, branches 3 , which are similar to entities, but they are not really, but are a graphical way of depicting some special cases of many-place relationships. The semantics of activity diagram elements are discussed in detail in Chapter 4. The main elements of the notation used in the activity diagram are shown below.
1.5.5. sequence diagram
sequence diagram(sequence diagram) is a way of describing the behavior of the system based on the indication of the sequence of transmitted messages.
In fact, a sequence diagram is a record of the protocol of a particular session of the system (or a fragment of such a protocol). In object-oriented programming, the most essential thing at runtime is the passing of messages between cooperating objects. It is the sequence of sending messages that is displayed on this diagram, hence the name.
In the sequence diagram, one main type of entities is used - instances of interacting classifiers 1 (mainly classes, components and actors), and one type of relationship - connections 2 through which messages are exchanged 3 . There are several ways to send messages, which in graphical notation differ in the form of an arrow corresponding to a relation.
An important aspect of the sequence diagram is the explicit display of the passage of time. Unlike other types of diagrams, except perhaps synchronization diagrams, in a sequence diagram, not only the presence of graphical links between elements matters, but also the relative position of elements on the diagram. Namely, it is considered that there is an (invisible) time axis, by default directed from top to bottom, and the message that is sent later is drawn below.
The time axis can be directed horizontally, in which case time is considered to flow from left to right.
The following figure shows the main elements of the notation used in a sequence diagram. To designate the interacting objects themselves, the standard notation is used - a rectangle with the name of a classifier instance. Dotted line, coming out of it, is called the line of life (lifeline) 4 . This is not a designation of a relationship in the model, but a graphical commentary intended to point the reader of the diagram in the right direction. Figures in the form of narrow strips superimposed on the life line are also not images of simulated entities. This is a graphical comment showing the length of time an object owns an execution occurrence 5 or in other words an activation of an object takes place. Compound interaction steps (combined fragment) 6 allow the sequence diagram to reflect the algorithmic aspects of the interaction protocol. See Chapter 4 for more details on sequence diagram notation.
1.5.6. Communication Diagram
Communication Diagram(communication diagram) - a way of describing behavior, semantically equivalent to a sequence diagram.
In fact, this is the same description of the message exchange sequence of interacting instances of classifiers, only expressed by other graphic means. Moreover, most tools can automatically convert sequence diagrams to communication diagrams and vice versa.
Thus, in the communication diagram, as well as in the sequence diagram, one main type of entities is used - instances of interacting classifiers 1 and one type of relationship - connections 2 . However, here the emphasis is not on time, but on the structure of relationships between specific instances.
The figure shows the main elements of the notation used in the communication diagram. To designate the interacting objects themselves, the standard notation is used - a rectangle with the name of a classifier instance. The mutual position of the elements on the diagram of cooperation does not matter - only the connections (most often instances of associations) are important, along which messages are transmitted 3 . To display the order of messages in time, hierarchical decimal numbering is used.
1.5.7. Component Diagram
Component Diagram(component diagram) - shows the relationship between the modules (logical or physical) that make up the simulated system.
The main type of entities in the component diagram is the components themselves 1 , as well as interfaces 2 , through which the relationship between the components is indicated. The following relationships apply in the component diagram:
- implementations between components and interfaces (the component implements the interface);
- dependencies between components and interfaces (a component uses an interface) 3 .
The figure shows the main elements of the notation used in the component diagram. A detailed description is given in chapter 3 .
1.5.8. Placement diagram
Placement diagram(deployment diagram), along with displaying the composition and relationships of system elements, shows how they are physically placed on computing resources during execution.
Thus, in the placement diagram, in comparison with the component diagram, two types of entities are added: artifact 1 , which is the implementation of component 2 and node 3 (can be either a classifier describing the node type or a specific instance), as well as an association relationship between nodes 4 , indicating that the nodes are physically linked at run time.
The figure shows the main elements of the notation used in the placement diagram. To show that one entity is a part of another, either a "deploy" dependency relationship 5 is used, or the shape of one entity is placed inside the shape of another entity 6 . A detailed description of the diagram is given in chapter 3.