Olap excel cubes. Creating an OLAP cube using Microsoft Query
Read also
OLAP (On-Line Analytical Processing) is an electronic data analytics method that represents the organization of data into hierarchical categories using pre-calculated totals. OLAP data are ordered hierarchically and are stored not in tables, but in cubes. OLAP cubes are a multidimensional dataset with axes on which parameters are plotted and cells containing parameter-dependent aggregate data. Cubes are designed for complex, multidimensional analysis of large amounts of data, because they provide only summary results for reports, instead of a large number of individual records.
The concept of OLAP was described in 1993 by the well-known database researcher and author of the relational data model, E. F. Codd. Currently, OLAP support is implemented in many DBMS and other tools.
An OLAP cube contains two types of data:
Total values, values for which you want to sum up, representing calculated data fields;
descriptive information that measurements or dimensions. Descriptive information is usually broken down into levels of detail. For example: "Year", "Quarter", "Month" and "Day" in the dimension "Time". By distributing fields into levels of detail, report users can choose the level of detail they want to view, starting with a high-level summary and then moving on to a more detailed view, and vice versa.
Microsoft Query tools also let you create OLAP cubes from a query that loads data relational database data, for example Microsoft Access, while the linear table is converted into a structural hierarchy (cube).
The OLAP Cube Creation Wizard is a built-in Microsoft Query tool. To create an OLAP cube based on a relational database, you must complete the following steps before running the wizard.
1. Define the data source (see Figure 6.1).
2. C help from Microsoft Query to create a query, including only those fields that will be either data fields or dimension fields of the OLAP cube, if the field in the cube is used more than once, then it must be included in the query the required number of times.
3. At the last step of the Query Creation Wizard, set the radio button to Create an OLAP cube from given request (see Fig. 6.2) or after the query has been created using the Query tools directly in the menu File choose a team Create an OLAP cube, which will launch the OLAP Cube Creation Wizard.
The OLAP Cube Creation Wizard has three steps.
At the first step of the wizard (see Figure 6.6), the data fields– Calculated fields for which you want to define totals.
Rice. 6.6. Defining data fields
Suggested calculated fields (usually numeric fields) the wizard places at the top of the list, flags and determines the final function of these fields, usually - Sum. When selecting data fields, at least one field must be selected as a calculated field, and at least one field must remain unchecked to define the dimension.
When creating an OLAP cube, four summary functions can be used − Sum, Number(number of values), Minimum, Maximum for numeric fields and one function Number for all other fields. If you want to use several different summary functions for the same field, that field must be included in the query as many times as needed.
Calculated field name can be changed in a column Data field name.
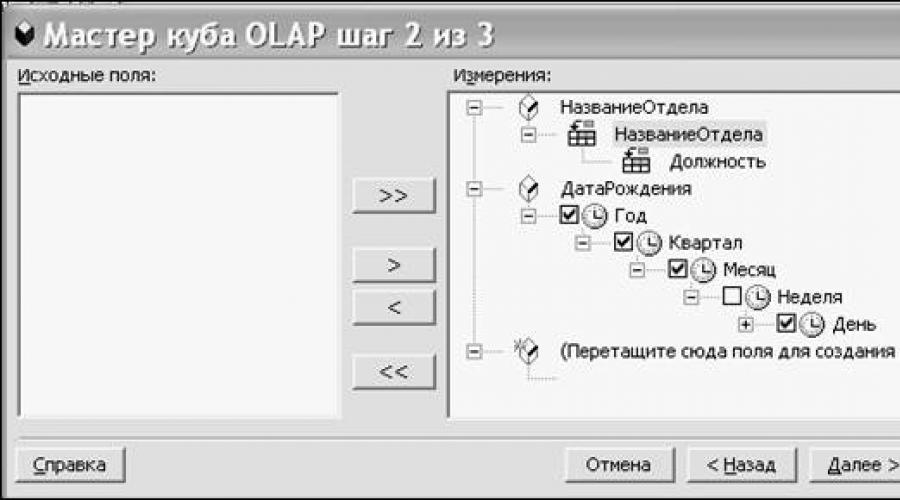
At the second step of the wizard, descriptive data and their dimensions are defined (see Figure 6.7). To select a dimension field, you need from the list Source fields drag the desired dimension field top level to the list measurements to the area marked as Drag fields here to create a dimension. To create an OLAP cube, you must define at least one dimension. At the same step of the wizard, using context menu you can change the dimension or level field name.

Rice. 6.7. Definition of dimension fields
Fields that contain isolated or distinct data and do not belong to a hierarchy can be defined as single-level dimensions. However, using a cube will be more efficient if some of the fields are organized into levels. To create a level as part of a dimension, drag a field from the list Source fields on a field that is a dimension or level. Fields containing more detailed information should be located at lower levels. For example, in Figure 6.7, the field Job title is the field level Department Name.
To move a field to a lower or higher level, you drag it to a lower or higher field within the dimension. The or buttons are used to display or hide the levels, respectively.
If date or time fields are used as the top-level dimension, the Create OLAP Cube Wizard automatically creates levels for those dimensions. The user can then select which levels should be present in the reports. For example, you can select weeks, quarters, and years, or months (see Figure 6.7).
Keep in mind that the wizard automatically creates levels for date and time fields only when you create the top-level dimension; when you add these fields as sublevels of an existing dimension, no automatic levels are created.
At the third step of the wizard, the type of cube created by the wizard is determined, while three options are possible (see Figure 6.8).

Rice. 6.8. Selecting the type of cube to be created at the third step of the wizard
· The first two options involve creating a cube each time the report is opened (if the cube is viewed from Excel, then we are talking about a pivot table). In this case, the request file and the file *.oqy cube definitions A containing instructions for creating the cube. The *.oqy file can be opened in Excel program To create reports based on the cube, and if you need to make changes to the cube, you can open it with Query to run the Create Cube Wizard again.
By default, cube definition files, as well as query files, are stored in the user's profile folder in Application Data\Microsoft\Que-ries. When saving the *.oqy file in the standard folder, the cube definition file name is displayed on the tab OLAP cubes when opening a new query in Microsoft Query or when selecting a command Create request(menu Data, submenu Importing external data) V Microsoft Excel.
In the case of choosing the third option of the cube type Saving a cube file containing all the data for a cube, all the data for the cube is retrieved and a cube file with extension * is created in the location specified by the user .cub in which this data is stored. Creation given file does not happen immediately when the button is clicked Ready; the file is created either when the cube definition is saved to a file, or when a report is generated from the cube.
The choice of cube type is determined by several factors: the amount of data that the cube contains; the type and complexity of the reports that will be generated based on the cube; system resources (memory and disk space), etc.
Separate file cube *.cub should be created in the following cases:
1) for interactive reports that change frequently if there is sufficient disk space;
2) when you need to save the cube on a network server to provide access to it for other users when creating reports. A cube file can provide specific data from the source database, while omitting secret or sensitive data that you want to prevent other users from accessing.
As part of this work, the following questions will be considered:
- What are OLAP cubes?
- What are measures, dimensions, hierarchies?
- What kinds of operations can be performed on OLAP cubes?
The main postulate of OLAP is multidimensionality in data presentation. In OLAP terminology, the concept of a cube, or hypercube, is used to describe a multidimensional discrete data space.
Cube is a multidimensional data structure from which an analyst user can query information. Cubes are created from facts and dimensions.
Data- this is data about objects and events in the company that will be subject to analysis. Facts of the same type form measures. A measure is a type of value in a cube cell.
measurements are the data elements on which the analysis of facts is performed. A collection of such elements forms an attribute of a dimension (for example, the days of the week can form an attribute of the dimension "time"). In the tasks of business analysis of commercial enterprises, such categories as "time", "sales", "products", "customers", "employees", "geographical location" often act as measurements. Dimensions are most often hierarchical structures that are logical categories against which the user can analyze the actual data. Each hierarchy can have one or more levels. So the hierarchy of the "geographic location" dimension can include levels: "country - region - city". In the hierarchy of time, for example, the following sequence of levels can be distinguished: A dimension can have several hierarchies (in this case, each hierarchy of one dimension must have the same key attribute of the dimension table).
A cube can contain actual data from one or more fact tables, and most often contains multiple dimensions. Any particular cube usually has a particular directional subject of analysis.
Figure 1 shows an example of a cube designed to analyze sales of petroleum products by a certain company by region. Given cube has three dimensions (time, product and region) and one measure (sales volume expressed in monetary terms). Measure values are stored in the corresponding cells (cell) of the cube. Each cell is uniquely identified by a set of members from each of the dimensions, called a tuple. For example, the cell located in the lower left corner of the cube (contains the value $98399) is given by the tuple [July 2005, Far East, Diesel]. Here the value of $98399 shows the volume of sales (in monetary terms) of diesel in the Far East in July 2005.
Also note that some cells do not contain any values: these cells are empty because the fact table does not contain data for them.
Rice. 1. Cube with information about sales of petroleum products in various regions
The ultimate goal of creating such cubes is to minimize the processing time of queries that extract the required information from the actual data. To accomplish this task, cubes typically contain precomputed summary data called aggregations(aggregations). Those. the cube covers a data space larger than the actual one - there are logical, calculated points in it. Aggregate functions allow you to calculate point values in a logical space based on actual values. The simplest aggregation functions are SUM, MAX, MIN, COUNT. So, for example, using the MAX function, for the cube shown in the example, you can identify when the peak in diesel sales occurred in the Far East, etc.
Another specific feature of multidimensional cubes is the difficulty in determining the origin point. For example, how do you set point 0 for the Product or Regions dimension? The solution to this problem is to introduce a special attribute that combines all elements of the dimension. This attribute (generated automatically) contains only one element - All ("All"). For simple aggregation functions such as sums, the All element is equivalent to the sum of the values of all elements in the actual space of the given dimension.
An important concept in the multidimensional data model is the subspace, or subcube. A subcube is a part of the total cube space in the form of some multidimensional figure inside the cube. Since the multidimensional space of a cube is discrete and bounded, the subcube is also discrete and bounded.
Operations on OLAP cubes
The following operations can be performed on an OLAP cube:
- cut;
- rotation;
- consolidation;
- detail.

Rice. 2. OLAP cube slice
Rotation(Figure 3) - the operation of changing the location of the measurements presented in the report or on the displayed page. For example, a rotation operation may involve swapping the rows and columns of a table. In addition, rotating a data cube is moving non-table dimensions to the location of the dimensions present on the displayed page, and vice versa.
OLAP is not a single software product, not a programming language, and not even a specific technology. If you try to cover OLAP in all its manifestations, then this is a set of concepts, principles and requirements that underlie software products that make it easier for analysts to access data. Let's find out For what analysts need something special facilitate data access.
The fact is that analysts are special consumers corporate information. The task of an analyst is to find patterns in large data sets. Therefore, the analyst will not pay attention to the single fact that on Thursday the fourth day a batch of black ink was sold to the counterparty Chernov - he needs information about hundreds and thousands similar events. Single facts in the database may be of interest, for example, to an accountant or the head of the sales department, in whose competence the transaction is located. One record is not enough for an analyst - for example, he may need all the transactions of a given branch or representative office for a month or a year. At the same time analyst discards unnecessary details like the buyer's TIN, his exact address and phone number, contract index and the like. At the same time, the data that an analyst needs to work necessarily contain numerical values - this is due to the very essence of his activity.
So, an analyst needs a lot of data, this data is selective and also has a nature " attribute set - number". The latter means that the analyst works with tables of the following type:
Here " A country", "Product", "Year" are attributes or measurements, A " Volume of sales" - thus a numerical value or measure. The task of the analyst, we repeat, is to identify persistent relationships between attributes and numerical parameters.. Looking at the table, you can see that it can be easily translated into three dimensions: on one of the axes we put countries, on the other - goods, on the third - years. And the values in this three-dimensional array will be the corresponding sales volumes.

3D representation of the table. The gray segment shows that there are no data for Argentina in 1988
It is precisely such a three-dimensional array in terms of OLAP that is called a cube. In fact, from the point of view of strict mathematics, such an array will not always be a cube: for a real cube, the number of elements in all dimensions must be the same, while OLAP cubes do not have such a limitation. However, despite these details, the term "OLAP cubes", due to its brevity and imagery, has become generally accepted. An OLAP cube doesn't have to be 3D at all. It can be both two-dimensional and multidimensional, depending on the problem being solved. Especially seasoned analysts may need about 20 measurements - and serious OLAP products are designed for just such a number. More simple desktop applications support about 6 dimensions.
measurements OLAP cubes are made up of so-called marks or members. For example, the dimension "Country" consists of the labels "Argentina", "Brazil", "Venezuela", and so on.
Not all elements of the cube should be filled in: if there is no information about sales of rubber products in Argentina in 1988, the value in the corresponding cell will simply not be determined. It is also not necessary that an OLAP application store data necessarily in a multidimensional structure - the main thing is that for the user this data looks exactly like that. By the way, it is precisely in special ways of compact storage of multidimensional data that "vacuum" (unfilled elements) in cubes does not lead to a waste of memory.
However, the cube itself is not suitable for analysis. If it is still possible to adequately represent or depict a three-dimensional cube, then with six or nineteen dimensions the situation is much worse. That's why before use ordinary cubes are extracted from a multidimensional cube two-dimensional tables. This operation is called "cutting" the cube. Again, this term is figurative. The analyst, as it were, takes and "cuts" the dimensions of the cube according to the marks of interest to him. In this way, the analyst receives a two-dimensional slice of the cube and works with it. In about the same way, lumberjacks count annual rings on a saw cut.
Accordingly, as a rule, only two dimensions remain "uncut" - according to the number of dimensions of the table. It happens that only the dimension remains "uncut" - if the cube contains several types of numerical values, they can be plotted according to one of the dimensions of the table.
If you take a closer look at the table that we depicted first, you can see that the data in it, most likely, are not primary, but are obtained as a result of summation for smaller items. For example, a year is divided into quarters, quarters into months, months into weeks, weeks into days. A country is made up of regions, and regions are made up of localities. Finally, in the cities themselves, districts and specific retail outlets can be distinguished. Products can be combined into commodity groups and so on. In terms of OLAP, such multilevel joins are quite logically called hierarchies. OLAP tools make it possible at any time to move to the desired level of the hierarchy. Moreover, as a rule, several types of hierarchies are supported for the same elements: for example, day-week-month or day-decade-quarter. The source data is taken from the lower levels of the hierarchies and then summarized to obtain the values of the higher levels. In order to speed up the transition process, the summed values for different levels are stored in a cube. Thus, what looks like one cube from the user's side, roughly speaking, consists of many more primitive cubes.

Hierarchy Example
This is one of the essential points that led to the emergence of OLAP - productivity and efficiency. Let's imagine what happens when an analyst needs to get information, and OLAP tools are not available in the enterprise. The analyst independently (which is unlikely) or with the help of a programmer makes an appropriate SQL query and receives the data of interest in the form of a report or exports it to a spreadsheet. There are a lot of problems with this. Firstly, the analyst is forced to do something other than his job (SQL programming) or wait for the programmers to do the task for him - all this negatively affects labor productivity, the assault, the heart attack and stroke level increase, and so on. Secondly, a single report or table, as a rule, does not save the giants of thought and the fathers of Russian analysis - and the whole procedure will have to be repeated again and again. Thirdly, as we have already found out, analysts do not ask for trifles - they need everything at once. This means (although the technology is advancing by leaps and bounds) that the enterprise relational database server accessed by the analyst can think deeply and for a long time, blocking the rest of the transactions.
The concept of OLAP appeared precisely to solve such problems. OLAP cubes are essentially meta-reports. By cutting meta-reports (cubes, that is) by dimensions, the analyst actually receives the "regular" two-dimensional reports of interest to him (these are not necessarily reports in the usual sense of the term - we are talking about data structures with the same functions). The advantages of cubes are obvious - data needs to be requested from a relational DBMS only once - when building a cube. Since analysts, as a rule, do not work with information that is supplemented and changed on the fly, the generated cube is relevant for quite a long time. Thanks to this, interruptions in the operation of the relational DBMS server are not only eliminated (there are no queries with thousands and millions of response lines), but the data access speed for the analyst himself is also dramatically increased. In addition, as already noted, performance is also improved by calculating subsums of hierarchies and other aggregated values at the time of cube construction. That is, if initially our data contained information about the daily revenue for a specific product in a single store, then when forming the cube, the OLAP application calculates the totals for different levels of hierarchies (weeks and months, cities and countries).
Of course, you have to pay for increasing productivity in this way. It is sometimes said that the data structure simply "explodes" - an OLAP cube can take up tens or even hundreds of times more space than the original data.
Answer the questions:
What's happened cube OLAP?
What's happened labels specific dimension? Give examples.
Can they measures V OLAP cube, contain non-numeric values.
Annotation: This lecture covers the basics of designing data cubes for OLAP data warehouses. The example shows how to build a data cube using the CASE tool.
The purpose of the lecture
After studying the material of this lecture, you will know:
- what is a data cube in OLAP data warehouse ;
- how to design a data cube for OLAP data warehouses ;
- what is a data cube dimension ;
- how the fact is related to the data cube;
- what are dimension attributes ;
- what is a hierarchy;
- what is a data cube metric;
and learn:
- build multidimensional charts ;
- design simple multidimensional charts.
Introduction
OLAP technology is not a stand-alone software, Not programming language. If you try to cover OLAP in all its manifestations, then this is a set of concepts, principles and requirements that underlie software products that make it easier for analysts to access data.
Analysts are the main consumers of corporate information. The task of an analyst is to find patterns in large data sets. Therefore, the analyst will not pay attention to the single fact that on a certain day a batch of ballpoint pens was sold to the buyer Ivanov - he needs information about hundreds and thousands of similar events. Single facts in the data warehouse may be of interest, for example, to an accountant or head of the sales department, whose competence is to support a specific contract. One record is not enough for an analyst - for example, he may need information about all sales point contracts for a month, quarter or year. Analytics may not be interested in the buyer's TIN or his phone number - he works with specific numerical data, which is the essence of his professional activity.
Centralization and convenient structuring are far from all that an analyst needs. He needs a tool for viewing, visualizing information. Traditional reports, even built on the basis of a single data warehouse, are deprived, however, of a certain flexibility. They cannot be "twisted", "expanded" or "collapsed" to get the desired view of the data. The more "slices" and "slices" of data an analyst can explore, the more ideas he has, which, in turn, require more and more "slices" for verification. As such a tool for data exploration, the analyst is OLAP.
Although OLAP is not a necessary attribute of a data warehouse, it is increasingly being used to analyze the information accumulated in this data warehouse.
Operational data is collected from various sources, cleaned, integrated and added to the data warehouse. At the same time, they are already available for analysis using various reporting tools. Then the data (in whole or in part) is prepared for OLAP analysis. They can be loaded into a special OLAP database or left in a relational data warehouse. The most important element of using OLAP is metadata, i.e. information about the structure, location and data transformation. Thanks to them, the effective interaction of various storage components is ensured.
Thus, OLAP can be defined as a set of tools for multidimensional analysis of data accumulated in a data warehouse. Theoretically, OLAP tools can be applied directly to operational data or exact copies. However, there is a risk of subjecting data to analysis that are not suitable for this analysis.
OLAP on client and server
At the heart of OLAP is multidimensional data analysis. It can be produced using various tools, which can be conditionally divided into client and server OLAP tools.
Client-side OLAP tools are applications that compute and display aggregated data (sums, averages, maximums, or minimums), and the aggregate data itself is cached within the address space of the OLAP tool.
If the source data is contained in a desktop DBMS, the aggregate data is calculated by the OLAP tool itself. If the source of the source data is a server DBMS, many of the client OLAP tools send SQL queries containing the GROUP BY clause to the server, and as a result receive aggregate data calculated on the server.
As a rule, OLAP functionality is implemented in tools statistical processing data (of the products of this class on the Russian market, products of Stat Soft and SPSS are widely used) and in some spreadsheets. In particular, Microsoft Excel 2000 has good multidimensional analysis tools. Using this product, you can create and save a small local multidimensional OLAP cube as a file and display its two- or three-dimensional sections.
Many development tools contain libraries of classes or components that allow you to create applications that implement the simplest OLAP functionality (such as the Decision Cube components in Borland Delphi and Borland C++Builder). In addition, many companies offer controls ActiveX and other libraries that implement similar functionality.
Note that client OLAP tools are used, as a rule, with a small number of dimensions (usually no more than six are recommended) and a small variety of values for these parameters - after all, the received aggregate data must fit in the address space of such a tool, and their number grows exponentially with an increase in the number measurements. Therefore, even the most primitive client OLAP tools, as a rule, allow you to make a preliminary calculation of the amount of required random access memory to create a multidimensional cube in it.
Many (but not all) client-side OLAP tools allow you to store the contents of the aggregate data cache as a file, which in turn prevents them from being recomputed. Note that this opportunity is often used to alienate aggregate data in order to transfer them to other organizations or for publication. A typical example such alienated aggregate data is the incidence statistics in different regions and in different age groups, which is open information, published by the ministries of health of various countries and the World Health Organization. At the same time, the original data itself, which is information about specific cases of diseases, are confidential data of medical institutions and in no case should fall into the hands of insurance companies, let alone become public.
The idea of storing a cache of aggregate data in a file has been further developed in server-side OLAP tools, in which the storage and modification of aggregate data, as well as the maintenance of the storage containing them, are carried out by a separate application or process called OLAP server. Client applications can request such multidimensional storage and receive some data in response. Some client applications may also create such stores or update them according to changed source data.
The advantages of using server OLAP tools compared to client OLAP tools are similar to the advantages of using server DBMS compared to desktop ones: in the case of using server tools, the calculation and storage of aggregate data occurs on the server, and the client application receives only the results of queries to them, which allows generally reduce network traffic, lead time requests and resource requirements consumed by the client application. Note that the analysis tools and enterprise-scale data processing, as a rule, are based precisely on server OLAP tools, for example, such as Oracle Express Server, Microsoft SQL Server 2000 Analysis Services, Hyperion Essbase, Crystal Decisions, Business Objects, Cognos, SAS Institute products. Since all the leading manufacturers of server DBMS produce (or have licensed from other companies) certain server OLAP tools, their choice is quite wide, and in almost all cases you can purchase an OLAP server from the same manufacturer as the database server itself.
Note that many client OLAP tools (in particular, Microsoft Excel 2003, Seagate Analysis, etc.) allow you to access server OLAP storages, acting in this case as client applications that execute similar requests. In addition, there are many products that are client applications for OLAP tools from various manufacturers.
Technical aspects of multidimensional data storage
Multidimensional data warehouses contain aggregate data of varying degrees of detail, for example, sales volumes by day, month, year, product category, etc. The purpose of storing aggregate data is to reduce lead time requests, since in most cases, for analysis and forecasts, it is not detailed, but summary data that is of interest. Therefore, when creating a multidimensional database, some aggregate data is always calculated and stored.
Note that saving all aggregate data is not always justified. The fact is that when adding new dimensions, the amount of data that makes up the cube grows exponentially (sometimes they say about the "explosive growth" of the amount of data). More specifically, the amount of aggregate data growth depends on the number of dimensions in the cube and the members of the dimensions at different levels of the hierarchies of those dimensions. To solve the problem of "explosive growth", various schemes are used that allow, when calculating far from all possible aggregate data, to achieve an acceptable speed of query execution.
Both source and aggregate data can be stored in either relational or multidimensional structures. Therefore, there are currently three ways to store data.
- MOLAP(Multidimensional OLAP) - source and aggregate data is stored in a multidimensional database. Storing data in multidimensional structures allows you to manipulate data as a multidimensional array, so that the speed of calculating aggregate values is the same for any of the dimensions. However, in this case, the multidimensional database is redundant, since the multidimensional data completely contains the original relational data.
- ROLAP(Relational OLAP) - The original data remains in the same relational database where it originally resided. Aggregate data is placed in service tables specially created for their storage in the same database.
- HOLAP(Hybrid OLAP) - The original data remains in the same relational database where it originally resided, while the aggregate data is stored in a multidimensional database.
Some OLAP tools support data storage only in relational structures, some - only in multidimensional ones. However, most modern OLAP server tools support all three data storage methods. The choice of storage method depends on the volume and structure of the source data, the requirements for the speed of query execution, and the frequency of updating OLAP cubes.
We also note that the vast majority of modern OLAP tools do not store "empty" values (an example of an "empty" value would be the absence of sales of seasonal goods out of season).
Basic OLAP Concepts
FAMSI test
The technology of complex multidimensional data analysis is called OLAP (On-Line Analytical Processing). OLAP is a key component of a data warehouse organization. The concept of OLAP was described in 1993 by Edgar Codd, a well-known database researcher and author of the relational data model. In 1995, based on the requirements set out by Codd, the so-called FASMI test(Fast Analysis of Shared Multidimensional Information) - fast analysis of shared multidimensional information, including the following requirements for applications for multidimensional analysis:
- Fast(Fast) - providing the user with analysis results in a reasonable time (usually no more than 5 s), even at the cost of less detailed analysis;
- Analysis(Analysis) - the possibility of carrying out any logical and statistical analysis characteristic of this application, and its preservation in a form accessible to the end user;
- shared(Shared) - multi-user access to data with support for appropriate locking mechanisms and authorized access tools;
- Multidimensional(Multidimensional) - Multidimensional conceptual representation of data, including full support for hierarchies and multiple hierarchies (this is a key OLAP requirement);
- Information(Information) - the application must be able to access any necessary information, regardless of its volume and storage location.
It should be noted that OLAP functionality can be implemented different ways, starting with the simplest data analysis tools in office applications and ending with distributed analytical systems based on server products.
Multidimensional representation of information
Cuba
OLAP provides a convenient, high-speed means of accessing, viewing and analyzing business information. The user gets a natural, intuitive data model, organizing them in the form of multidimensional cubes (Cubes). The axes of the multidimensional coordinate system are the main attributes of the analyzed business process. For example, for sales it can be a product, region, type of buyer. Time is used as one of the measurements. At the intersections of the axes of measurements (Dimensions) there are data that quantitatively characterize the process - measures (Measures). These can be sales volumes in pieces or in monetary terms, stock balances, costs, etc. A user analyzing information can "cut" the cube in different directions, get summary (for example, by years) or, conversely, detailed ( weekly) information and perform other manipulations that come to his mind in the process of analysis.
As measures in the three-dimensional cube shown in Fig. 26.1, sales amounts are used, and time, product and store are used as measurements. Measurements are presented at specific grouping levels: products are grouped by category, stores are grouped by country, and transaction times are grouped by month. A little later we will look at grouping levels (hierarchies) in more detail.
Rice. 26.1.
"Cutting" the cube
Even a three-dimensional cube is difficult to display on a computer screen so that the values of the measures of interest can be seen. What can we say about cubes with more than three dimensions. To visualize the data stored in a cube, as a rule, the usual two-dimensional, i.e., tabular representations are used, which have complex hierarchical row and column headers.
A two-dimensional representation of a cube can be obtained by "cutting" it across along one or more axes (dimensions): we fix the values of all dimensions, except for two, and we get a regular two-dimensional table. The horizontal axis of the table (column headers) represents one dimension, the vertical axis (row headers) represents another dimension, and the table cells represent measure values. In this case, the set of measures is actually considered as one of the dimensions: we either select one measure for display (and then we can place two dimensions in the headers of rows and columns), or we show several measures (and then one of the axes of the table will be occupied by the names of the measures, and the other - values of a single "uncut" dimension).
(levels). For example, the labels presented on are not supported by all OLAP tools. For example, both types of hierarchy are supported in Microsoft Analysis Services 2000, while only balanced ones are supported in Microsoft OLAP Services 7.0. Different in different OLAP tools can be the number of hierarchy levels, and the maximum allowable number of members of one level, and the maximum possible number of dimensions themselves.OLAP Application Architecture
Everything that was said above about OLAP, in fact, referred to the multidimensional presentation of data. Roughly speaking, neither the end user nor the developers of the tool that the client uses care about how data is stored.
Multidimensionality in OLAP applications can be divided into three levels.
- Multidimensional data representation - end-user tools that provide multidimensional visualization and data manipulation; the multidimensional representation layer abstracts from the physical structure of the data and treats the data as multidimensional.
- Multidimensional processing is a tool (language) for formulating multidimensional queries (traditional relational SQL language turns out to be unusable here) and a processor capable of processing and executing such a request.
- Multidimensional Storage - Tools physical organization data that provide efficient execution of multidimensional queries.
The first two levels are mandatory in all OLAP tools. The third level, although widely used, is not required, since data for multidimensional representation can also be retrieved from ordinary relational structures; the multidimensional query processor in this case translates multidimensional queries into SQL queries that are executed by a relational DBMS.
Specific OLAP products are usually either a multidimensional data presentation tool (OLAP client - for example, Pivot Tables in Excel 2000 from Microsoft or ProClarity from Knosys) or a multidimensional back-end DBMS (OLAP server - for example, Oracle Express Server or Microsoft OLAP Services).
The multidimensional processing layer is usually built into the OLAP client and/or OLAP server, but can be isolated in its purest form, such as Microsoft's Pivot Table Service component.
/ In a cubist manner. The use of OLAP cubes in the management practice of large companies
In contact with
Classmates
Konstantin Tokmachev, system architect
in a cubist way.
The use of OLAP cubes in the management practice of large companies
Perhaps the time has already passed when the computing resources of the corporation were spent only on the registration of information and accounting reports. At the same time, managerial decisions were made “by eye” in offices, at meetings and meetings. Perhaps in Russia it is time to return to corporate computing systems their main resource– solving control problems based on the data registered in the computer
About the benefits of business intelligence
In the corporate management loop, between the “raw” data and the “levers” of influencing the managed object, there are “performance indicators” - KPIs. They form, as it were, a "dashboard", reflecting the state of various subsystems of the controlled object. To equip the company with informative performance indicators and control their calculation and the values obtained is the work of a business analyst. Significant assistance in organizing the analytical work of a corporation can be provided by automated analysis services, such as the MS SQL Server Analysis Services (SSAS) and its main dispositive is an OLAP cube.
There is one more note to be made right here. For example, in the American tradition, a specialty focused on working with OLAP cubes is called BI (Business Intelligence). There should be no illusions that the American BI corresponds to the Russian "business analyst". No offense, but often our business analyst is a “under-accountant” and “under-programmer”, a specialist with fuzzy knowledge and a small salary, who really does not have any of his own tools and methodology.
A BI specialist is, in fact, an applied mathematician, a high-class specialist who puts modern mathematical methods into service with firms (what was called Operations Research - methods of operations research). BI is more in line with the specialty “system analyst” that used to be in the USSR, which was produced by the faculty of the VMK of Moscow State University. M.V. Lomonosov. The OLAP cube and analysis services can become a promising basis for the workplace of a Russian business analyst, perhaps after some improvement in his qualifications towards American BI.
Recently, another harmful trend has emerged. Thanks to specialization, mutual understanding between different categories of employees of the corporation has been lost. An accountant, manager and programmer, like a "swan, cancer and pike" in the fable of I.A. Krylov, pulling the corporation in different directions.
The accountant is busy reporting, its amounts, both in meaning and in dynamics, are not directly related to the business process of the company.
The manager is busy with his segment of the business process, but is not able to assess globally, at the level of the company as a whole, the results and prospects of his actions.
Finally, the programmer, who was once (thanks to education) the conductor of advanced technical ideas from the sphere of science to the sphere of business, has turned into a passive executor of the fantasies of an accountant and manager, so it is no longer uncommon when accountants and in general everyone who not lazy. The uninitiated, illiterate, but relatively highly paid 1C programmer is a real scourge of Russian corporations. (Almost like a domestic football player.) I'm not talking about the so-called "economists and lawyers", everything has been said about them for a long time.
So, the position of a business analyst, equipped with a high-tech SSAS apparatus, who knows the basics of programming and accounting, is able to consolidate the work of the company in relation to the analysis and forecast of the business process.
Benefits of OLAP cubes
OLAP cube is modern facility analysis of the database of the corporate computer system, which allows providing employees of all levels of the hierarchy with the required set of indicators that characterize the production process of the company. The point is not only that user-friendly interface and a flexible query language for the MDX cube (MultiDimensional eXpressions) allow you to formulate and calculate the necessary analytical indicators, but at the remarkable speed and ease with which this is done by an OLAP cube. Moreover, these speed and ease, within certain limits, do not depend on the complexity of the calculations and the volume of the database.
Some understanding of OLAP
cube can give " pivot table» MS Excel. These objects have similar logic and similar interfaces. But, as will be seen from the article, the functionality of OLAP is incomparably richer, and the performance is incomparably higher, so that the "pivot table" remains a local desktop product, while OLAP is an enterprise-level product.
Why is an OLAP cube so well suited for solving analytical problems? The OLAP cube is designed in such a way that all indicators in all possible sections are pre-calculated (in whole or in part), and the user only has to “pull out” the required indicators (measures measures) and sections (dimensions dimensions) with the mouse, and the program redraws the plates.
All possible analytics in all sections form one huge field, or rather, not a field, but just a multidimensional OLAP cube. Whatever request a user (manager, business analyst, manager) makes to the analytics service, the response speed is due to two things: firstly, the required analytics can be easily formulated (either selected from the list by name, or given by a formula in the MDX language ), and secondly, as a rule, it has already been calculated.
The formulation of analytics is possible in three versions: it is either a database field (more precisely, a warehouse field), or a calculation field defined at the cube design level, or an MDX language expression when working with the cube interactively.
This means several attractive features of OLAP cubes at once. In fact, the barrier between the user and the data disappears. A barrier in the form of an application programmer, who, firstly, needs to explain the problem (set a task). Secondly, you will have to wait until the application programmer creates the algorithm, writes and debugs the program, then it may be modified. If there are many employees and their requirements are varied and changeable, then a whole team of applied programmers is needed. In this sense, an OLAP cube (and a qualified business analyst) in terms of analytical work replaces a whole team of application programmers, just like a powerful excavator with a backhoe driver when digging a ditch replaces a whole brigade of guest workers with shovels!
In this case, another very important quality of the obtained analytical data is achieved. Since the OLAP cube is one for the entire company, i.e. Since this is the same field with analysts for all, an annoying inconsistency in the data is excluded. When a manager has to set the same task to several independent employees in order to eliminate the subjectivity factor, but they still bring different answers, which everyone undertakes to explain somehow, etc. The OLAP cube ensures the uniformity of analytical data at different levels of the corporate hierarchy, i.e. if the manager wants to detail a certain indicator of interest to him, then he will certainly come to the lower-level data that his subordinate works with, and this will be just the data on the basis of which the higher-level indicator is calculated, and not some other data, received in some other way, at some other time, etc. That is, the whole company sees the same analytics, but at different levels of consolidation.
Let's take an example. Suppose a manager controls accounts receivable. As long as the KPI of overdue receivables is green, then everything is normal, no management actions are required. If the color has changed to yellow or red, something is wrong: we cut the KPI by sales department and immediately see the divisions “in red”. The next section on managers - and the seller, whose customers are late in payments, is defined. (Further on, the amount of delay can be broken down by buyers, by terms, etc.) The head of the corporation can directly address violators at any level. But in general, the same KPI (at their hierarchy levels) is seen by both department heads and sales managers. Therefore, in order to correct the situation, they do not even need to wait for a “call on the carpet” ... Of course, the KPI itself does not necessarily have to be the amount of delinquency - it can be a weighted average delinquency period or, in general, the rate of receivables turnover.
Note that the complexity and flexibility of the MDX language, together with fast (sometimes instantaneous) results, allows you to solve (taking into account the stages of development and debugging) challenging tasks controls, which under other conditions, perhaps, would not have been set at all due to the complexity for applied programmers and the initial uncertainty in the formulation. (Long timeframes for application programmers to solve analytical problems due to a poorly understood formulation and long program modifications when conditions change are often encountered in practice.)
Let's also pay attention to the fact that each employee of the company can collect from the general field the OLAP analyst exactly the crop that he needs for work, and not be content with the “strip” that he has cut in the communal “standard reports”.
A multi-user interface for working with an OLAP cube in client-server mode allows each employee, independently of others, to have their own (even their own production with some skill) analytics blocks (reports), which, once defined, are automatically updated - in other words, they are always up to date condition.
That is, the OLAP cube allows you to make analytical work (which is actually done not only by note analysts, but, in fact, by almost all employees of the company, even logisticians and managers who control balances and shipments) more selective, “from the face not in a general expression” , which creates conditions for improving work and increasing productivity.
Summing up our introduction, we note that the use of OLAP cubes can raise the management of a company to a higher level. Uniformity of analytical data at all levels of the hierarchy, their reliability, complexity, ease of creating and modifying indicators, individual settings, high speed of data processing, and finally, saving money and time spent on supporting alternative analytics paths (application programmers, independent calculations of an employee), open prospects for the use of OLAP-cubes in the practice of large Russian companies.
OLTP + OLAP: outline feedback in the company management chain
Now consider the general idea of OLAP cubes and their point of application in the corporate management chain. The term OLAP (OnLine Analytical Processing) was introduced by the British mathematician Edgar Codd in addition to his earlier term OLTP (OnLine Transactions Processing). This will be discussed later, but E. Codd, of course, proposed not only the terms, but also the mathematical theories of OLTP and OLAP. Without going into details, in the modern interpretation of OLTP is a relational database, considered as a mechanism for registering, storing and retrieving information.
Solution methodology
Such ERP-systems (Enterprice Resource Planning), as 1C7, 1C8, MS Dynamics AX, have user-oriented software interfaces (input and correction of documents, etc.), and a relational database (DB) for storing and retrieving information presented today software products type MS SQL Server (SS).
Note that the information registered in the database of the ERP system is indeed a very valuable resource. The point is not only that the registered information provides the corporation's current workflow (document issuance, their correction, the possibility of printing and reconciliation, etc.) and not only the possibility of calculating financial statements(taxes, audit, etc.). From a management point of view, it is much more important that an OLTP system (relational database) is, in fact, an actual digital model of a corporation's activities in full size.
But in order to manage the process, it is not enough to register information about it. The process should be presented as a system of numerical indicators (KPI) characterizing its course. In addition, allowable ranges of values must be defined for indicators. And only if the value of the indicator goes beyond the allowable interval, a control action should follow.
Regarding such logic (or mythology) of control (“management by deviation”), both the ancient Greek philosopher Plato, who created the image of the helmsman (cybernos), who leans on the oar when the boat deviates from the course, and the American mathematician Norbert Wiener, who created the science of cybernetics on the threshold of era of computers.
In addition to the usual system for recording information using the OLTP method, one more system is needed - a system for analyzing the collected information. This add-in, which in the control loop plays the role of feedback between management and the control object, is an OLAP system or, in short, an OLAP cube.
As software implementation OLAP, we will consider the MS Analysis Services utility, which is part of the standard delivery of MS SQL Server, abbreviated as SSAS. Note that according to E. Codd's idea, the OLAP cube in analytics should give the same exhaustive freedom of action that the OLTP system and relational database (SQL Server) give in storing and retrieving information.
OLAP Logistics
Now let's consider the specific configuration of external devices, applications and technological operations on which the automated operation of the OLAP cube is based.
We will assume that the corporation uses an ERP system, for example, 1C7 or 1C8, within which information is registered in the usual manner. The database of this ERP-system is located on a certain server and is maintained by MS SQL Server.
We will also assume that software is installed on another server, including MS SQL Server with the MS Analysis Services (SSAS) utility, as well as MS SQL Server Management Studio, MS C#, MS Excel, and MS Visual Studio programs. These programs together form the required context: the tools and necessary interfaces for the OLAP cube developer.
The SSAS server has the freeware blat installed, called (with parameters) from command line and providing postal services.
At employee workstations, within local network, among other things, MS Excel programs (versions of at least 2003) are installed, and also, possibly, special driver to enable MS Excel to work with MS Analysis Services (unless the corresponding driver is already included in MS Excel).
For definiteness, we will assume that the workstations of employees have operating system Windows XP, and on servers - Windows Server 2008. Also, let's say MS SQL Server 2005 is used as SQL Server, and Enterprise Edition (EE) or Developer Edition (DE) is installed on the server with the OLAP cube. In these editions, it is possible to use the so-called. "semi-additive measures", i.e. additional aggregate functions(statistics) other than the usual sums (for example, extreme or average value).
OLAP cube design (OLAP cubism)
Let's say a few words about the design of the OLAP cube itself. In the language of statistics, an OLAP cube is a set of performance indicators calculated in all necessary sections, for example, a shipment indicator in sections by buyers, by goods, by dates, etc. Due to the direct translation from English in Russian literature on OLAP cubes, indicators are called "measures", and cuts are called "dimensions". This is a mathematically correct, but syntactically and semantically not very successful translation. The Russian words "measure", "measurement", "dimension" almost do not differ in meaning and spelling, while the English "measure" and "dimension" are different both in spelling and in meaning. Therefore, we prefer traditional Russian statistical terms similar in meaning to "indicator" and "cut".
There are several options for the software implementation of the OLAP cube in relation to the OLTP system where the data is logged. We will consider only one scheme, the simplest, most reliable and fastest.
In this schema, OLAP and OLTP do not have common tables, and OLAP analytics are calculated as detailed as possible at the Cube Update (Process) stage prior to the usage stage. This scheme is called MOLAP (Multidimensional OLAP). Its disadvantages are asynchrony with ERP and high memory costs.
Although formally an OLAP cube can be built using all (thousands) tables of an ERP system relational database as a data source and all (hundreds) of their fields as indicators or sections, in reality this should not be done. Vice versa. To load into a cube, it is more correct to prepare a separate database called a “showcase” or “warehouse” (warehouse).
There are several reasons why this is the case.
- Firstly, linking an OLAP cube to tables in a real database will certainly create technical problems. Changing data in a table can trigger a refresh of the cube, and refreshing a cube is not necessarily a fast process, so the cube will be in a state of permanent rebuilding; at the same time, the procedure for updating the cube can block (during reading) the data of the database tables, slowing down the work of users in registering data in the ERP system.
- Secondly, the presence of too many indicators and cuts will dramatically increase the storage area of the cube on the server. Let's not forget that the OLAP cube stores not only the initial data, as in the OLTP system, but also all the indicators summed up over all possible sections (and even over all combinations of all sections). In addition, the speed of updating the cube and, eventually, the speed of building and updating analytics and user reports based on them will slow down accordingly.
- Third, too much a large number of fields (measures and aspects) will create problems in the OLAP developer interface, because the lists of elements will become endless.
- Fourth, An OLAP cube is very sensitive to data integrity violations. A cube cannot be built if the key data is not located by a link specified in the link structure of the cube fields. Temporary or permanent violation of integrity, blank fields are common in the database of an ERP system, but this is categorically not suitable for OLAP.
You can also add that the ERP system and the OLAP cube should be located on different servers in order to share the load. But then, if there are common tables for OLAP and OLTP, there is also a problem network traffic. Practically unsolvable problems appear in this case if it is necessary to consolidate several heterogeneous ERP systems (1C7, 1C8, MS Dynamics AX) into one OLAP cube.
Probably, it is possible to pile up technical problems further. But most importantly, remember that, unlike OLTP, OLAP is not a means of registering and storing data, but an analytics tool. This means that there is no need to load and load "dirty" data from ERP to OLAP "just in case". On the contrary, you must first develop a concept for managing a company, at least at the KPI system level, and then design an application data warehouse (warehouse) located on the same server as the OLAP cube and containing a small refined amount of ERP data necessary for management .
Without promoting bad habits, the OLAP cube in relation to OLTP can be likened to the well-known "alembic", through which from the "fermented mass" real registration the "pure product" is recovered.
So, we got that the data source for OLAP is a special database (warehouse) located on the same server as OLAP. Basically, this means two things. First, there must be special procedures that will create a warehouse from ERP databases. Secondly, the OLAP cube is asynchronous with its ERP systems.
Taking into account the above, we propose the following version of the architecture of the computational process.
Solution architecture
Let there be many ERP systems of a certain corporation (holding) on different servers, for which we would like to see the analytical data consolidated within one OLAP cube. We emphasize that in the described technology, we combine data from ERP systems at the warehouse level, leaving the design of the OLAP cube unchanged.
On the OLAP server, we create images (blank copies) of the databases of all these ERP systems. To these empty copies, we periodically (nightly) perform partial replication of the databases of the corresponding actively running ERPs.
Next, SP (stored procedure) is launched, which on the same OLAP server without network traffic, on the basis of partial replicas of the databases of ERP systems, creates (or replenishes) the storage (warehouse) - the data source of the OLAP cube.
Then the standard procedure for updating / building a cube according to the warehouse data is launched (the Process operation in the SSAS interface).
Let's comment on some aspects of the technology. What kind of work do SPs do?
As a result of partial replication, actual data appears in the image of some ERP system on the OLAP server. By the way, partial replication can be done in two ways.
First, of all the tables in the database of the ERP system, during partial replication, only those that are needed to build the warehouse are copied. This is controlled by a fixed list of table names.
Secondly, partial replication may also mean that not all fields of the table are copied, but only those that are involved in building the warehouse. The list of fields to be copied is either specified or dynamically created in the SP from the copy image (if the copy of the table does not initially contain all the fields).
Of course, it is possible not to copy entire table rows, but only to add new records. However, this creates a serious inconvenience when accounting for ERP revisions "backdating", which is often found in real-life systems. So it's easier, without further ado, to copy all records (or update the "tail" starting from some date).
Further, the main task of SP is to convert data from ERP systems to the warehouse format. If there is only one ERP-system, then the task of transformation is mainly reduced to copying and possibly reformatting the necessary data. But if it is necessary to consolidate several ERP systems of different structure in the same OLAP cube, then the transformations become more complicated.
Particularly difficult is the task of consolidating several different ERP systems in a cube, if the sets of their objects (directories of goods, contractors, warehouses, etc.) partially intersect, the objects have the same meaning, but naturally they are described differently in the directories different systems(in the sense of codes, identifiers, names, etc.).
In reality, such a picture arises in a large holding company, when several autonomous companies of the same type that make up it carry out approximately the same types of activities in approximately the same territory, but use their own and uncoordinated registration systems. In this case, when consolidating data at the warehouse level, you cannot do without auxiliary mapping tables.
Let's pay some attention to the warehouse storage architecture. Typically, an OLAP cube schema is represented as a "star", i.e. as a data table surrounded by "rays" of directories - tables of secondary key values. The table is a block of "indicators", reference books are their cuts. At the same time, the directory, in turn, can be an arbitrary unbalanced tree or a balanced hierarchy, for example, a multi-level classification of goods or counterparties. In an OLAP cube, the numeric fields of the data table from the warehouse automatically become "indicators" (or measures measures), and sections (or dimensions) can be defined through tables of secondary keys.
This is a visual "pedagogical" description. In fact, the architecture of an OLAP cube can be much more complex.
Firstly, a warehouse may consist of several "asterisks", possibly linked through common directories. In this case, the OLAP cube will be a union of several cubes (multiple data blocks).
Secondly, the "ray" of the asterisk may not be one directory, but an entire (hierarchical) file system.
Thirdly, on the basis of existing dimension cuts, new hierarchical cuts can be defined using the OLAP developer interface (say, with fewer levels, with a different order of levels, etc.)
Fourthly, new indicators (calculations) can be defined on the basis of existing indicators and sections using the expression of the MDX language. It is important to note that new cubes, new indicators, new sections are automatically fully integrated with the original elements. It should also be noted that poorly formulated calculations and hierarchical cuts can noticeably slow down the work of an OLAP cube.
MS Excel as an interface with OLAP
Of particular interest is the user interface with OLAP cubes. Naturally, the SSAS utility itself provides the most complete interface. This is an OLAP cube developer toolkit, an interactive report designer, and a window for interactive work with an OLAP cube using queries in the MDX language.
In addition to SSAS itself, there are many programs that provide an interface to OLAP, covering their functionality to a greater or lesser extent. But among them there is one, which, in our opinion, has undeniable advantages. This is MS Excel.
The interface with MS Excel is provided by a special driver, which can be downloaded separately or included with Excel. It does not cover all the functionality of OLAP, but with the growth of MS Excel version numbers, this coverage is becoming wider (say, in MS Excel 2007 a KPI graphic appears, which was not in MS Excel 2003, etc.).
Of course, in addition to a fairly complete functionality, the main advantage of MS Excel is the ubiquitous distribution of this program and the close acquaintance with it of the vast majority of office users. In this sense, unlike other interface programs, the firm does not need to acquire anything additionally and does not need to train anyone additionally.
The big advantage of MS Excel as an interface with OLAP is the possibility of further independent processing of data obtained in an OLAP report (that is, the continuation of the study of data obtained from OLAP on other sheets of the same Excel, no longer using OLAP tools, but using ordinary Excel tools).
Nightly facubi treatment cycle
Now let's describe the daily (nightly) computing cycle of OLAP operation. The calculation is carried out under the control of the facubi program, written in C # 2005 and launched using Task Scheduler on a server with warehouse and SSAS. In the beginning, facubi accesses the internet and reads the current exchange rates (used to represent a number of indicators in a currency). Next, the following steps are performed.
First, facubi launches SPs that perform partial database replication of various ERP systems (holding elements) available on the local network. Replication is performed, as we said, on pre-prepared "yards" - images of remote ERP systems located on the SSAS server.
Secondly, through SP, a mapping is performed from ERP replicas to warehouse storage - a special DB that is the source of OLAP cube data and located on the SSAS server. This accomplishes three main tasks:
- ERP data are brought under the required cube formats; we are talking about tables and table fields. (Sometimes the required table needs to be “molded”, say, from several MS Excel sheets.) Similar data can have a different format in different ERPs, for example, key ID fields in 1C7 directories have a 36-character code of length 8, and _idrref fields in directories 1C8 - hexadecimal numbers with a length of 32;
- during processing logical control of data is carried out (including prescribing “defaults” default in place of missing data, where possible) and integrity control, i.e. checking the presence of primary and secondary keys in the corresponding classifiers;
- code consolidation objects that have the same meaning in different ERPs. For example, the corresponding elements of directories of different ERPs can have the same meaning, say, this is the same counterparty. The problem of code consolidation is solved by building mapping tables, where various codes the same objects are brought to unity.
Thirdly, facubi launches the standard Process cube data update procedure (from the SSAS utility procedures).
According to the checklists, facubi sends out e-mail messages about the progress of the processing steps.
After executing facubi, the Task Scheduler runs several excel files, which have pre-created reports based on OLAP cube metrics. As we said, MS Excel has a special programming interface (separately downloadable or built-in driver) for working with OLAP cubes (with SSAS). When you start MS Excel, programs on MS VBA (such as macros) are included, which provide updating of data in reports; reports are modified if necessary and sent by mail (blat program) to users according to checklists.
Local network users with access to the SSAS server will receive "live" reports configured for the OLAP cube. (In principle, they themselves, without any mail, can update OLAP reports in MS Excel, lying on their local computers.) Users outside the local network will either receive original reports, but with limited functionality, or for them (after updating OLAP reports in MS Excel) special "dead" reports will be calculated that do not contact the SSAS server.
Evaluation of results
We talked above about the asynchrony of OLTP and OLAP. In the considered version of the technology, the OLAP cube update cycle is performed at night (say, it starts at 1 am). This means that in the current working day, users work with yesterday's data. Because OLAP is not a logging tool (see the latest version of the document), but a management tool (understand the trend of the process), this backlog is usually not critical. However, if necessary, even in the described version of the cube architecture (MOLAP), it is possible to update several times a day.
The execution time of the update procedures depends on the design features of the OLAP cube (more or less complexity, more or less successful definitions of indicators and sections) and on the volume of databases of external OLTP systems. According to experience, the procedures for building a warehouse take from several minutes to two hours, the procedure for updating a cube (Process) takes from 1 to 20 minutes. It's about about complex OLAP cubes that combine dozens of structures of the "asterisk" type, about dozens of common "rays" (reference cuts) for them, about hundreds of indicators. Estimating the volume of databases of external ERP systems by shipping documents, we are talking about hundreds of thousands of documents and, accordingly, millions of product lines per year. The historical depth of processing of interest to the user was three to five years.
The described technology is used in a number of large corporations: since 2008 in the Russian Fish Company (RRK) and the Russian Sea Company (RM), since 2012 in the Santa Bremor Company (SB). Some of the corporations are predominantly trade-purchasing firms (RRK), others are production firms (fish and seafood processing plants in the Republic of Moldova and the Security Council). All corporations are large holdings that unite several companies with independent and various computer accounting systems - ranging from standard ERP systems such as 1C7 and 1C8 to "relic" accounting systems based on DBF and Excel. I will add that the described technology for operating OLAP cubes (without taking into account the development stage) either does not require special employees at all, or is included in the responsibilities of one full-time business analyst. The task has been spinning for years automatic mode, supplying various categories of corporate employees with up-to-date reporting on a daily basis.
Pros and cons of the solution
As experience shows, the variant of the proposed solution is quite reliable and easy to operate. It is easily modified (connecting / disconnecting new ERPs, creating new indicators and sections, creating and modifying Excel reports and their mailing lists) with the invariance of the facubi control program.
MS Excel as an interface with OLAP provides sufficient expressiveness and allows you to quickly join the OLAP technology in different categories office workers. The user receives daily "standard" OLAP reports; using the MS Excel interface with OLAP, can independently create OLAP reports in MS Excel. In addition, the user can independently continue to explore the information of OLAP reports using the usual capabilities of his MS Excel.
A “refined” warehouse database, in which several heterogeneous ERP systems are consolidated (during the cube construction), even without any OLAP, allows solving (on the SSAS server, using the Transact SQL query method or the SP method, etc.) a lot of applied management tasks. Recall that the warehouse database structure is unified and much simpler (in terms of the number of tables and the number of table fields) than the database structures of the original ERP.
We especially note that in our proposed solution there is the possibility of consolidating various ERP systems in one OLAP cube. This allows you to get analytics for the entire holding and maintain long-term continuity in analytics when a corporation moves to another ERP accounting system, say, when moving from 1C7 to 1C8.
We used the MOLAP cube model. The advantages of this model are reliability in operation and high speed of processing user requests. Cons - asynchronous OLAP and OLTP, as well as large amounts of memory for storing OLAP.
In conclusion, let's give one more argument in favor of OLAP, which, perhaps, would have been more appropriate in the Middle Ages. Because its probative power rests on authority. The modest, clearly underestimated British mathematician E. Codd developed the theory of relational databases in the late 60s. The strength of this theory was such that now, after 50 years, it is already difficult to find a non-relational database and a database query language other than SQL.
OLTP technology, based on the theory of relational databases, was E. Codd's first idea. In fact, the concept of OLAP cubes is his second idea, expressed by him in the early 90s. Even if you're not a mathematician, you might well expect the second idea to be just as effective as the first. That is, in terms of computer analytics, OLAP ideas will soon take over the world and supplant all others. Simply because the topic of analytics finds its exhaustive mathematical solution in OLAP, and this solution is “adequate” (B. Spinoza's term) to the practical task of analytics. “Adequately” means in Spinoza that even God himself could not have come up with a better idea ...
- Larson B. Development of business intelligence in Microsoft SQL Server 2005. - St. Petersburg: "Piter", 2008.
- Codd E. Relational Completeness of Data Base Sublanguages, Data Base Systems, Courant Computer Science Sumposia Series 1972, v. 6, Englwood cliffs, N.Y., Prentice–Hall.
In contact with