Filter the air! We audit network traffic using tcpdump. Tcpdump utility, examples options filters Tcpdump description
For UNIX systems there are a wide variety of sniffers and traffic analyzers with a convenient graphical interface and a rich set of functions. But none of them can compare in flexibility, versatility and ubiquity with the old tcpdump. This utility is included in many Linux distributions and all BSD systems out of the box and can help you out when other means are unavailable.
Introduction
The tcpdump utility is a network packet sniffer with a command line interface that has neither a graphical nor a pseudo-graphical interface. To beginners it may seem awkward and too old-fashioned, but in skillful hands it turns into a real Swiss knife to open any network packets and protocols. Experienced system administrators always recommend that beginners use tcpdump instead of any other utilities because of the clarity and straightforwardness of its reports.
Tcpdump was born almost 25 years ago at the University of Berkeley, is still actively developing and continues to be the standard among similar tools for operating system UNIX. The packet capture library libpcap, developed specifically for it, is today used by almost every sniffer for UNIX systems and many similar programs for Windows.
In this article we will look at all aspects of working with tcpdump, starting from the basics of working with the program and ending with how to use the utility to identify network attacks, anomalies and various types of failures.
Alone with the console
Let's try to figure out how tcpdump works and from which side it should be approached. Open a terminal and run the program as root (like any sniffer, tcpdump must have full access to network interfaces), specifying the name of the network interface and limiting the number of output packets to ten:
# tcpdump -i wlan0 -c 10 -n
The -n switch disables the resolution of IP addresses to DNS names. Now let's try to track the exchange only with a specific host, for example with a home router:
# tcpdump -i wlan0 -c 10 -n host 192.168.0.1 and port 53
Let's see what tcpdump brought us, using the example of the two lines presented in the screenshot “DNS query through the eyes of tcpdump”. You can easily understand that this is a DNS request (port 53) from host 192.168.0.101 to host 192.168.0.1 and the subsequent response. But what do all the other numbers and signs mean?
The numbers 16:22:41.340105 are the time the packet was sent, including millionths of a second (the so-called frac). The two letters IP, as you might guess, identify the network layer protocol used, followed by the address: sending port and address: destination port of the packet. Everything that comes after the colon directly depends on the transport or application layer protocol used. tcpdump is familiar with some protocols and can decipher them into a human-readable form, while others it leaves as is and simply lists the contents of the packet. In this case, tcpdump decrypted the DNS messages and returned string 49244+ A? ya.ru. (23), which means: a request (A?) was sent to the address associated with the name ya.ru., the total length of the packet minus the TCP/IP headers was 23 bytes. The first digit is the request ID.
In the next line we see a response, the format of which is almost the same as the request, with the only difference being that now after the request identifier there is information about the number of records found (8/2/3) and the records themselves (A 213.180.204.3, A 77.88.21.3 , A 87.250.250.3...).
tcpdump has support for many protocols, thanks to which it can present in readable form information about the TCP, UDP and ICMP, SMB/CIFS, NFS, AFS, AppleTalk protocols. But what if tcpdump doesn't know anything about the application layer protocol being used or can't determine it? Normally it will simply print out the packet information. It might look something like this:
Flags [.], seq 3666073194:3666074622, ack 3281095139, win 2000, options , length 1428
This is a TCP packet, the format for presenting information about it in tcpdump is as follows (fields are separated by commas):
- flags - installed flags. Indicated by the symbols S (SYN), F (FIN), P (PUSH) and R (RST), the dot means no flags are set;
- data-seqno - describes the data contained in the packet in the following format: first:last, where first and last are the sequence number of the first and last byte of the transmitted data, nbytes;
- ack - next sequence number (ISN + 1);
- window - window size;
- options - additional information can be specified here, for example (maximum segment size);
- length - packet length.
All this data can be very useful when studying or debugging protocols and network applications, however, they do not tell us anything about its contents. To see the package contents in hexadecimal format, use the -X flag:
# tcpdump -i wlan0 -c 10 -n -X host 192.168.0.1 and port 80
This function is very convenient to use for analyzing protocols in which data is transferred in clear text, such as HTTP. For binary and encrypted protocols, it will, of course, be useless.
You can also use the -v flag to get more information about the package. Then after IP in parentheses it will appear detailed information about the IP package:
(tos 0x0, ttl 64, id 8339, offset 0, flags , proto UDP (17), length 51)
In general, everything here is quite prosaic. First comes the type of service (TOS), followed by the packet's time to live (TTL), packet ID, offset from the beginning of the first packet in the chain, flags, transport layer puncture used (TCP, UDP, ICMP) and length.

Advanced Features
We've already covered most of tcpdump's most important features, but there's much more to its functionality. For example, we used the host and port operators to specify the address and port we needed to filter the output, but what if we only wanted to see packets going to specified address, but not coming from it? You can use the src operator for this:
# tcpdump -i wlan0 -c 10 -n src 192.168.0.1
There is also its reverse version dst, designed to indicate the destination address. As shown above, all operators can be combined using the and operator (monitoring network traffic, excluding SSH sessions and DNS queries):
# tcpdump -i wlan0 port not 22 and port not 53
You can also use or (or) and except (not). Additionally, tcpdump understands port ranges:
# tcpdump -i wlan0 -c 10 -n portrange 21-23
Can filter packets by their size:
# tcpdump -i wlan0 -c 10 -n > 32 and<= 128
And understands subnet masks:
# tcpdump -i wlan0 c 10 -n src net 192.168.0.0/16 and dst net 10.0.0.0/8 or 172.16.0.0/16
One of the most interesting features of tcpdump is the ability to filter packets based on the content of specific bits or bytes in the protocol headers. The following format is used for this: proto, where proto is the protocol, expr is the offset in bytes from the beginning of the packet header, and size is an optional field indicating the length of the data in question (default is 1 byte). For example, to filter only packets with the SYN (TCP handshake initiation) flag set, you would use the following entry:
# tcpdump "tcp==2"
How it works? Very simple. The 13 bytes of the TCP header contain exactly eight flags, one bit for each. The second bit is reserved for the SYN flag. The following entry simply verifies that this bit is set. By the way, a more readable form of this entry would look like this:
# tcpdump "tcp & tcp-syn != 0"
Practical use
The tcpdump utility is commonly used for two purposes: for debugging the network, network applications and new protocols, and for teaching the basics of TCP/IP. We'll go the other way and use tcpdump's capabilities to detect host scanning and conduct network attacks.
In Fig. Figure 1 shows what a classic TCP port scan performed with the Nmap utility looks like in the tcpdump logs. You can clearly see how Nmap from the address 192.168.0.100 tries to establish a TCP connection with different ports by sending a SYN packet (S in the flags field). First, port 8888 is probed, an RST packet is received in response, which means that the port is not listening by any service, then port 587 is probed with the same result. Finally, Nmap sends a SYN packet to port 22 (SSH) and receives a response in the form of a SYN-ACK packet:
192.168.0.100.43337 > 192.168.0.111.22: Flags [S], seq 2610024277, ... 192.168.0.111.22 > 192.168.0.100.43337: Flags , seq 3496707239, ack 2610 024278, ... 192.168.0.100. 43337 > 192.168.0.111.22: Flags [.], ack 1, ...
The port is open and Nmap can now successfully close the connection by sending an RST packet and move on to the next ports. However, it does something smarter: it sends an acknowledgment of the ACK packet and immediately moves on to the next ports. This behavior allows you to bypass some intrusion detection systems, but a person armed with a sniffer cannot be fooled so easily.
Also pay attention to the numbers of the ports being searched; they are not generated randomly, but are selected taking into account the greatest prevalence. This means that a quick scan is being performed, or more precisely, Nmap is most likely running without any flags at all.

Now let's look at another method for detecting open ports - SYN scanning (nmap -sS). This type of scan is usually called hidden, because during it a full TCP connection is never established, which means that information about the fact of the connection does not appear in the logs. The tcpdump output for this type of scan is shown in Fig. 2. It is very similar to the log of a regular TCP scan, but the scanner’s response to open ports now another one:
192.168.0.100.48585 > 192.168.0.111.22: Flags [S], seq 1679394613, ... 192.168.0.111.22 > 192.168.0.100.48585: Flags , seq 625029896, ack 16793 94614, ... 192.168.0.100. 48585 > 192.168.0.111.22: Flags [R], seq 1679394614, ... 
It can be seen that after receiving the SYN-ACK approval packet, the scanner does not complete the connection establishment, but immediately breaks it, avoiding getting into the logs. In Fig. 3 you can see the result of the UDP scan. Everything is very simple here, Nmap enumerates ports with possible UDP services, sending a zero-length packet to each of them. If the port is closed, the OS responds with an ICMP unreachable message:
16:41:48.798310 IP 192.168.0.100.61020 > 192.168.0.111.18869: UDP, length 0 16:41:48.798346 IP 192.168.0.111 > 192.168.0.100: ICMP 192.168 .0.100 udp port 18869 unreachable, length 36 
Otherwise, the port is considered open. Another scanning method: null scanning by sending packets that do not contain any flags set (nmap -sN). The response to such packets may vary depending on the OS used, but as you can see from the following listing, Linux responds to them by sending RST packets:
192.168.0.100.39132 > 192.168.0.111.256: Flags , win 3072, length 0 192.168.0.111.256 > 192.168.0.100.39132: Flags , ...
An attacker can also use Xmas scanning, in which packets have the FIN, URG and PUSH flags set (the packet appears to glow with flags, like a Christmas tree):
192.168.0.100.35331 > 192.168.0.111.5544: Flags , seq 3998959601, win 4096, urg 0, length 0 192.168.0.111.5544 > 192.168.0.100.35331: Flags , seq 0,ack 3998959602
As you can see, the reaction to such packages is identical. An ACK scan (-sA) will appear in the tcpdump logs as sending multiple packets with the ACK flag set and responding to them by sending RST packets. However, if the system has a firewall installed, no response messages will be sent and Nmap will be able to understand whether the port is being filtered.
Using tcpdump you can also track various types of floods. For example, a classic ICMP flood in the logs will look like this:
16:43:06.008305 IP 192.168.0.100 > 192.168.0.111: ICMP type-#68, length 1032 16:43:06.008383 IP 192.168.0.100 > 192.168.0.111: ICMP type-#34, length 103 2 16:43:06.008714 IP 192.168.0.100 > 192.168.0.111: ICMP type-#183, length 1032 16:43:06.008831 IP 192.168.0.100 > 192.168.0.111: ICMP type-#192, length 1032
Of particular importance here is the field containing the time the packet was received. No normal application will send many ICMP messages in a period of time equal to one thousandth of a second. Other types of flood (for example, SYN) are defined in exactly the same way.
Interaction with other programs
One of the most important advantages of tcpdump is that the format of its reports during the existence of the program has actually become a standard for all sniffers and today it is understood by all more or less serious traffic analysis tools. For example, tcpdump can be used to generate a dump on a remote machine, and then send it to the local machine and analyze it using wireshark:
$ssh [email protected] tcpdump -w - "port !22" | wireshark -k -i -
Here we used the -w - option to write the dump to standard output and redirected it to wireshark running on the local machine. In the same way, you can analyze traffic using snort:
$ssh [email protected]"tcpdump -nn -i eth1 -w -" | snort -c /etc/snort/snort.conf -r -
By redirecting program output to the grep input, you can find various problems in the network, for example, identifying packets with an incorrect checksum, information about which can be displayed using the -vv flag:
# tcpdump -nnvv -r dump.cap tcp | grep -v "tcp sum ok" | wc–l
Admin stuff
The ability to filter packets based on data contained in the header, which we discussed at the beginning of the first section, is very convenient to use for debugging various protocols and searching network problems. For example, we can use it to catch network packets transmitted via the Cisco Discovery Protocol, through which Cisco routers exchange information about the topology and state of the network:
# tcpdump -nn -v -i eth0 -s 1500 -c 1 "ether == 0?2000"
In the same way, you can catch all packets transmitted via the DHCP protocol (DISCOVER, REQUEST, INFORM) to identify client connection problems:
# tcpdump -i eth0 -vvv -s 1500 "((port 67 or port 68) and (udp = 0x1))"
Or catch packets transmitted as part of POP3 authentication:
# tcpdump -i eth0 "tcp port pop3 and ip = 85 and ip = 83" -s 1500 -n
Network grep
The tcpdump sniffer is good for its versatility and variety of capabilities, but it is not so easy and convenient to use to search for specific data inside transmitted packets. This task is handled much better by ngrep, which is designed to display passing network packets that match a given mask.
For example, to find parameters passed by the GET and POST methods within an HTTP session, you can use the following command:
# ngrep -l -q -d eth0 "^GET |^POST " tcp and port 80
Identifying slackers:
# ngrep -i "game*|p0rn|adult" -W byline -d eth0 > slackers.txt
We analyze SMTP traffic on all network interfaces:
# ngrep -i "rcpt to|mail from" tcp port smtp
tcpdump options
Table of the most interesting and useful tcpdump flags.
- -i [interface] - the network interface to listen on, any should be specified for all.
- -n - do not resolve IP addresses to DNS names.
- -nn - do not convert IP addresses and port numbers.
- -X - show package contents in text and hexadecimal formats.
- -XX - the same plus the contents of the Ethernet frame.
- -v, -vv, -vvv - increase the amount of information and packets displayed (more, even more, all).
- -c [n] - show only the first n packets.
- -s [n] - number of bytes displayed for each packet (can be reduced for readability or increased for more information).
- -S - show absolute TCP sequence numbers.
- -e - show Ethernet frame headers.
- -q - show less information (for easier reading).
- -E - decrypt IPsec traffic using the specified key.
- -w - save the program dump to a file, argument - used to specify stdout.
conclusions
In the hands of a knowledgeable user, tcpdump turns into a powerful tool not only for debugging, but also for investigating anomalies. Thanks to a rich set of operators and flags, it can be used to pull out of the network ether and explore what you really need.
Therefore, I decided to create my own cheat sheet so that it would be... Because without tcpdump, more than one admin is a non-administrator
Introduction
Very often, to find problems in the network, they use network traffic analyzers . tcpdump is one of the representatives of this class of programs, it allows you to listen (display/save) and analyze the operation of the network at the level of transmitted network packets, frames and other units of network traffic transmission. Depending on the network configuration, tcpdump can listen not only packets destined for a given MAC address, but also broadcast packets. Eavesdropping network packet interception is based on "promiscuous" mode network adapter operation.
Depending on the used network equipment to connect computers to Ethernet networks there are the following traffic listening capabilities:
- Online based concentrators all traffic from the hub is available to any network host.
- In networks based switches(switches) the network host has access only to its traffic, as well as all broadcast traffic of this segment.
- Some managed switches have the function of copying the traffic of a given port to the monitoring port ("mirroring", port monitoring).
- When using special means (couplers) included in the gap network connection and sending connection traffic to a separate port, it is possible to listen on the corresponding port.
- The “trick” with a hub is that the switch port whose traffic needs to be listened to is turned on through the hub, also connecting a monitor node to the hub (in this case, in most cases, the performance of the network connection is reduced).
So, tcpdump utility included in most Unix distributions and allows you to intercept and display/save network traffic to a file. The utility uses libpcap library. There is also a port for Windows. It is required for the utility to work. For example, on Debian it is installed using the command:
Debian:~# apt-get install tcpdump
The utilities are necessary for operation (since the network interface settings are changed - it is switched to “promiscuous” mode). In general tcpdump command format has the following form:
Debian:~# tcpdump<опции> <фильтр>
tcpdump utility options
-i interface
Specifies the interface from which traffic should be analyzed (without specifying the interface - analysis of the “first one that comes up”).
Disables IP translation to domain names. If -nn is specified, conversion of port numbers to protocol names is prohibited.
The most commonly used filter options for the tcpdump command are:
dst host
Checks whether the destination address of an IP packet matches the specified value. It is possible to set both IP, subnet in 10.0.0.1/24 format, and host name.
src host
Checks whether the source address of an IP packet matches the specified value. It is possible to set both IP, subnet in 10.0.0.1/24 format, and host name.
host host
Checks whether the sender or recipient address matches the specified value. It is possible to set both IP, subnet in 10.0.0.1/24 format, and host name.
net network_name
Checks whether the sender/receiver address is on the specified network. It is possible to specify the network in CIDR format (for example, 10.0.0.1/22), or to specify the name of the network specified in .
ip | arp | rarp | tcp | udp | icmp [host]
Checks whether the packet belongs to one of the specified protocols and, when specifying a host address, checks whether the sender/recipient address matches the specified one. It is possible to set both IP, subnet in 10.0.0.1/24 format, and host name.
dst port port_number
Checks whether the package belongs to TCP protocol/UDP and whether the destination port is equal to the specified one. You can specify the port number or the name specified in the /etc/services file.
src port port_number
It is checked whether the packet belongs to the TCP/UDP protocol and whether the source port is equal to the specified one. You can specify the port number or the name specified in the /etc/services file.
port port_number
It is checked whether the packet belongs to the TCP/UDP protocol and whether the destination or source port is equal to the specified one. You can specify the port number or the name specified in the /etc/services file.
ip broadcast
Checks whether the IP packet is a broadcast packet.
ether ( src | dst | host ) MAC_address
Checks whether the network packet belongs to the source, destination, source or destination having the given MAC_address.
ether broadcast
Checks whether the ARP packet is a broadcast packet.
Examples of using the tcpdump command
Traffic analysis at the network level (ARP, ICMP) using tcpdump
Let's assume we have 2 hosts. Host 1 with interface eth0 and the following parameters:
Host1:~# ip addr show dev eth0 5: eth0:
And also host2 with interface eth1
Host2:~# ip addr show dev eth1 3: eth1:
Let's assume that until now there has been no network data exchange between the hosts, and if you run the ip neigh show command on host 2, you will see that there are no entries in the ARP table. Let's do a little experiment. Let's run the tcpdump utility on one of the host1 virtual interfaces:
Host1:~# tcpdump -ne -i eth0 tcpdump: verbose output suppressed, use -v or -vv for full protocol decode listening on eth0, link-type EN10MB (Ethernet), capture size 65535 bytes
Host1:~# ping -c 1 192.168.56.33 PING 192.168.56.33 (192.168.56.33) 56(84) bytes of data.
64 bytes from 192.168.56.33: icmp_req=1 ttl=64 time=1.06 ms --- 192.168.56.33 ping statistics --- 1 packets transmitted, 1 received, 0% packet loss, time 0ms rtt min/avg/max/mdev = 1.067/1.067/1.067/0.000 ms
After this, an entry about the IP address of host2 appeared in the ARP table of the host1 system:
Host1:~# ip neigh show dev eth0 192.168.56.33 lladdr 01:00:27:77:e5:00 HOST2
On the virtual console tcpdump displayed the following information to us:
Host1:~# tcpdump -ne -i eth0 tcpdump: verbose output suppressed, use -v or -vv for full protocol decode listening on eth0, link-type EN10MB (Ethernet), capture size 65535 bytes 12:16:29.465780 0a:00 :27:00:00:00 > ff:ff:ff:ff:ff:ff, ethertype ARP (0x0806), length 42: Request who-has 192.168.56.33 tell 192.168.56.1, length 28 12:16:29.466786 01 :00:27:77:e5:00 > 0a:00:27:00:00:00, ethertype ARP (0x0806), length 42: Reply 192.168.56.33 is-at 01:00:27:77:e5:00 , length 28 12:16:29.466815 0a:00:27:00:00:00 > 01:00:27:77:e5:00, ethertype IPv4 (0x0800), length 98: 192.168.56.1 > 192.168.56.33: ICMP echo request, id 5284, seq 1, length 64 12:16:29.467934 01:00:27:77:e5:00 > 0a:00:27:00:00:00, ethertype IPv4 (0x0800), length 98: 192.168 .56.33 > 192.168.56.1: ICMP echo reply, id 5284, seq 1, length 64 ^C 4 packets captured 4 packets received by filter 0 packets dropped by kernel Each network packet record in this format contains the time the packet was intercepted, the source and destination MAC addresses, the protocol type, the length of the packet, and information about the contents of the packet. First recording describes an ARP broadcast request from the MAC address of interface eth0 of system host1 (""). Who has the address 192.168.56.33, it says 192.168.56.1 Second entry - response from the MAC address of host2 to the MAC address of host1 (""). 192.168.56.33 has a MAC address of 01:00:27:77:e5:00 (Third and fourth entries ICMP request And) are the result of the ping command running on host1. Then tcpdump was interrupted. Before shutting down, tcpdump prints operation statistics: the number of packets intercepted, received by the filter, and discarded by the kernel
Thus, the host1 system, in order to send a standard echo request to the host2 machine, first received the MAC addresses of the host2 machine using the ARP protocol and entered it, bound to the IP address, into its ARP table.
Traffic analysis at the transport layer (TCP, UDP) using tcpdump
Let's assume that a certain WEB server is installed on the host2 system. Let's try to open a page from this web server on the host1 machine using the lynx console browser:
Host1:~# lynx 192.168.56.33
On another console, first run tcpdump with filtering parameters:
Host1:~# tcpdump -n -i eth0 host 192.168.56.33 and port 80 tcpdump: verbose output suppressed, use -v or -vv for full protocol decode listening on eth0, link-type EN10MB (Ethernet), capture size 65535 bytes 15 :44:37.837393 IP 192.168.56.1.41533 > 192.168.56.33.80: Flags [S], seq 1209026235, win 5840, options , length 0 15:44:37.838118 IP 192.168.56.33.80 > 19 2.168.56.1.41533: Flags , seq 370041518, ack 1209026236, win 5792, options , length 0 15:44:37.838157 IP 192.168.56.1.41533 > 192.168.56.33.80: Flags [.], ack 1, win 46, options , length 15 : 44:37.839254 IP 192.168.56.1.41533 > 192.168.56.33.80: Flags , seq 1:222, ack 1, win 46, options , length 221 15:44:37.839921 IP 192.168.56.33.80 > 192. 168.56.1.41533 : Flags [.], ack 222, win 1716, options , length 0 15:44:37.848118 IP 192.168.56.33.80 > 192.168.56.1.41533: Flags , seq 1:446, ack 222, win 1716, options , length 445 15:44:37.848156 IP 192.168.56.1.41533 > 192.168.56.33.80: Flags [.], ack 446, win 54, options , length 0 15:44:37.849738 IP 192.168.56.33.80 > 192.1 68.56.1. 41533: Flags , seq 446, ack 222, win 1716, options , length 0 15:44:37.850366 IP 192.168.56.1.41533 > 192.168.56.33.80: Flags , seq 222, ack 447, win 54, options , length 0 15:44:37.851267 IP 192.168.56.33.80 > 192.168.56.1.41533: Flags [.], ack 223, win 1716, options , length 0 ...
IN in this example the client (192.168.56.1) from TCP port 41533 establishes a connection with the server (192.168.56.33) listening on port 80, makes a request, receives the necessary data, and the connection ends.
TCP segment header, in addition to recipient and sender port numbers contains a number of parameters:
- Sequence number(seq). Determines the order of the bytes in the stream sent to the network (the offset of the first byte in the segment relative to the beginning of the data stream).
- Confirmed number(ACK). The maximum byte number in the received segment is increased by 1. Acknowledgments sent to the sender simultaneously serve as a request for a new portion of data.
- Control flags(SYN - S, ACK, FIN -F, RST - R, PSH - P, URG)
- Window(win) - the number of bytes of data expected by the sender of the data, starting from the byte whose number is indicated in the ack field. To optimize transmission, the sender does not wait for an acknowledgment for each sent segment, but can send a group to the network to the segment (but in bytes no larger than the window size). If the quality of the channel is poor (many requests for retransmission, confirmations are lost), the window decreases; if it is good, the window increases.
- Options. Used to solve auxiliary problems. For example, MSS (Maximum segment size) is transmitted - the maximum segment size.
The process of establishing a bidirectional TCP connection is reflected in the first three tcpdump entries:
- The client sends the server a TCP segment with the SYN flag set, the initial “random” number (1209026235), from which the bytes in the stream it sends will be numbered, the maximum window size is the amount that the server is allowed to transmit without confirmation from the client (5840): 15: 44:37.837393 IP 192.168.56.1.41533 > 192.168.56.33.80: Flags [S], seq 1209026235, win 5840, options , length
- The server sends the client a TCP segment with the SYN and ACK flags set, a starting "random" number (370041518) from which the bytes in the stream it sends will be numbered, and the maximum window size for the client (5792). This segment also confirms receipt of a connection request from the client: 15:44:37.838118 IP 192.168.56.33.80 > 192.168.56.1.41533: Flags , seq 370041518, ack 1209026236, win 5792, options , length
- The client sends the server a TCP segment with the ACK flag set, which is a confirmation of receiving the segment from the server (hereinafter, tcpdump displays the relative values of seq and ask): 15:44:37.838157 IP 192.168.56.1.41533 > 192.168.56.33.80: Flags [. ], ack 1, win 46, options , length
After that the connection is considered established.
In the next pair of records, the client sends an application layer protocol request (221 bytes) to the server in the segment data section and receives confirmation from the server of its receipt:
15:44:37.839254 IP 192.168.56.1.41533 > 192.168.56.33.80: Flags , seq 1:222, ack 1, win 46, options , length 221 15:44:37.839921 IP 192.168.56.33.80 > 1 92.168.56.1 .41533: Flags [.], ack 222, win 1716, options , length 0
In this case, the PSH (P) flag is used to notify the sending side that the receiving side is ready to receive data. Next, the server sends the data to the client (445 bytes) and receives confirmation of receipt from it:
15:44:37.848118 IP 192.168.56.33.80 > 192.168.56.1.41533: Flags , seq 1:446, ack 222, win 1716, options , length 445 15:44:37.848156 IP 192.168.56.1.41 533 > 192.168.56.33 .80: Flags [.], ack 446, win 54, options , length 0
Then, at the server's initiative, the connection is terminated. The server sends a packet with the FIN flag set:
15:44:37.849738 IP 192.168.56.33.80 > 192.168.56.1.41533: Flags , seq 446, ack 222, win 1716, options , length 0
The client also responds by sending a packet with the FIN flag set; this packet is also a confirmation of receipt of a request to terminate the connection from the server:
15:44:37.850366 IP 192.168.56.1.41533 > 192.168.56.33.80: Flags , seq 222, ack 447, win 54, options , length 0
The server can only confirm receipt of the FIN segment from the client:
15:44:37.851267 IP 192.168.56.33.80 > 192.168.56.1.41533: Flags [.], ack 223, win 1716, options , length 0
Reaction of tcpdump to an attempt to connect to a closed port 23/tcp:
21:56:14.381091 IP 192.168.56.1.54040 > 192.168.56.33.23: Flags [S], seq 2956835311, win 5840, options , length 0 21:56:14.381688 IP 192.168.56.33.23 > 192.168.56.1.54040 : Flags, seq 0, ack 2956835312, win 0, length 0In this example, an attempt is made from system 192.168.56.1 to connect to a non-existent TCP service on node 192.168.56.33. The remote system responds by sending a segment with the RST (reset) flag set.
tcpdump response to sending a UDP datagram to a closed port 53/udp:
21:55:16.925906 IP 192.168.56.1.41979 > 192.168.56.33.53: 6561+ A? www.tut.by. (28) 21:55:16.926615 IP 192.168.56.33 > 192.168.56.1: ICMP 192.168.56.33 udp port 53 unreachable, length 64
This example attempts to send a UDP datagram to a non-existent port on a remote system. UDP typically responds by sending an ICMP message to the source host that the port is unreachable.
Other examples of using the tcpdump command:
# tcpdump -n -i ppp0 ether src 11:20:b3:d8:d8:2cConclusion network statistics from the ppp0 interface (-i ppp0) without IP to DNS conversion (-n) of those frames whose source MAC address is 11:20:b3:d8:d8:2c.
# tcpdump -n -e -i vlan0 ether broadcast
Output of broadcast traffic from the vlan0 interface.
# tcpdump -n -i eth0 src 192.168.66.1
Network packets whose header contains the IP address 192.168.66.1 in the source field are filtered.
# tcpdump -n -i eth0 host 192.168.66.1
Packets in which this IP address is specified as the source or destination of the packet are filtered.
# tcpdump -n -i eth0 src net 10.0.0.0 mask 255.0.0.0
Packets whose source indicates network nodes 10.0.0.0/8 are filtered.
# tcpdump -n -i eth0 icmp
Outputs only ICMP packets from the eth0 interface.
This is where I’ll probably end the current article. I will update the article as new examples appear. I hope that the material will be useful not only to me
The article used examples and some materials from intuit lectures.
Best regards, McSim!
This tutorial will show you how to isolate traffic in various ways—from IP, to port, to protocol, to application-layer traffic—to make sure you find exactly what you need as quickly as possible.
tcpdump is the tool everyone should learn as their base for packet analysis.
Install tcpdump with apt install tcpdump (Ubuntu), or yum install tcpdump (Redhat/Centos)
Let’s start with a basic command that will get us HTTPS traffic:
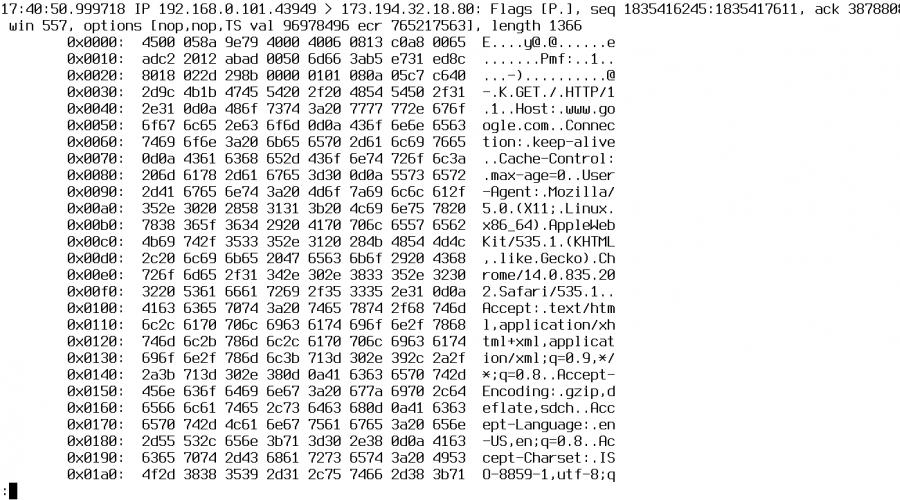
tcpdump -nn S X port 443
04:45:40.573686 IP 78.149.209.110.27782 > 172.30.0.144 .443 : Flags [.], ack 278239097, win 28, options , length 0 0x0000: 4500 0034 0014 0000 2e06 c005 4e8e d16e E..4........N..n 0x0010: ac1e 0090 6c86 01bb 8e0a b73e 1095 9779 ....l......>...y 0x0020: 8010 001c d202 0000 0101 080a 3803 7b55 ............8.(U 0x0030: 4801 8100
You can get a single packet with -c 1 , or n number with -c n .
This showed some HTTPS traffic, with a hex display visible on the right portion of the output (alas, it’s encrypted). Just remember—when in doubt, run the command above with the port you’re interested in, and you should be on your way.
Examples
PacketWizard™ isn’t really trademarked, but it should be.

a practitioner preparing to run tcpdump
Now that you are able to get basic traffic, let’s step through numerous examples that you are likely to need during your job in networking, security, or as any type of PacketWizard™.
Everything on an interface
Just see what’s going on, by looking at what’s hitting your interface.
Or get all interfaces with -i any .
tcpdump -i eth0
Find Traffic by IP
One of the most common queries, using host , you can see traffic that’s going to or from 1.1.1.1.
Expression Types:
host, net, and port.
src and dst.
host, net, and port.
tcp, udp, icmp, and many more.
tcpdump host 1.1.1.1
06:20:25.593207 IP 172.30.0.144.39270 > one.one.one.one .domain : 12790+ A? google.com. (28) 06:20:25.594510 IP one.one.one.one .domain > 172.30.0.144.39270: 12790 1/0/0 A 172.217.15.78 (44)
If you only want to see traffic in one direction or the other, you can use src and dst .
tcpdump src 1.1.1.1
tcpdump dst 1.0.0.1
Finding Packets by Network
To find packets going to or from a particular network or subnet, use the net option.
You can combine this with the src and dst options as well.
tcpdump net 1.2.3.0/24
Get Packet Contents with Hex Output
Hex output is useful when you want to see the content of the packets in question, and it’s often best used when you’re isolating a few candidates for closer scrutiny.
tcpdump -c 1 -X icmp

Summary
Here are the takeaways.
- tcpdump is a valuable tool for anyone looking to get into networking or .
- The raw way it interfaces with traffic, combined with the precision it offers in inspecting packets make it the best possible tool for learning TCP/IP.
- Protocol Analyzers like Wireshark are great, but if you want to truly master packet-fu, you must become one with tcpdump first.
Well, this primer should get you going strong, but the man page should always be handy for the most advanced and one-off usage scenarios. I truly hope this has been useful to you, and feel free to if you have any questions.
Notes
- I’m currently (sort of) writing a book on tcpdump for No Starch Press.
- The leading image is from SecurityWizardry.com.
- Some of the isolation filters borrowed from
tcpdump instructions in Russian and examples.
-A specifies the output of each packet (without link-layer headers) in ASCII format. This mode is useful for collecting HTTP traffic.
-c <число пакетов>specifies that the program terminates after capturing a specified number of packets.
-C<размер файла>specifies whether to check the size of the capture file before each new packet is written to it. If the file size exceeds the file_size parameter, the file is closed
and is created new file to write packets to it. For capture files, the name specified by the -w parameter is used and, starting from the second file, the name is added as
suffix file number. The file_size variable specifies the file size in millions of bytes (not megabytes = 1,048,576 bytes).
-d specifies the output of a dump of the compiled package-matching code in a human-readable format and the termination of the program.
-dd Dumps the matching code as a C program fragment.
-ddd dumps the match code as a string of decimal values, preceded by a string with the counter value.
-D displays a list of network interfaces on the system from which tcpdump can collect packets. Each network interface has a name and number, which may be followed by
text description of the interface. The interface name and number can be used with the -i flag to specify packet collection from a single interface.
This option can be very useful for systems that do not provide information about available network interfaces3.
The -D flag is not supported if tcpdump was compiled with old version libpcap, which does not support the pcap_findalldevs() function.
-e prints the link-layer header on each line of the dump.
-E specifies the use of the spi@ipaddr algorithm and secret to decrypt IPsec ESP packets sent to the ipaddr address and containing the and value in the Security Parameter Index field
spi. The combination of spi and address can be repeated using a comma or new line. Note that setting the secret for IPv4 ESP packets in
currently supported.
The algorithms that can be used are des-cbc, 3des-cbc, blowfish-cbc, rc3-cbc, cast128-cbc or none. The default algorithm is des-cbc. Possibility of decryption
packages is provided only in cases where cryptography support options were enabled when tcpdump was compiled.
The secret parameter contains the ASCII text of the ESP secret key. If the secret begins with 0x characters, it will read hexadecimal value. The option assumes the use
ESP according to RFC 2406, not RFC 1827. This option is only supported for debugging purposes and should be used with real world secret keys should not, since entered in
command line The IPsec key is available to other users of the system4.
In addition to explicitly specifying options on the command line, they can be specified in an options file that tcpdump will read when it receives the first ESP packet.
-f sets the output of foreign IPv4 addresses in numeric format. Using this option allows you to get rid of problems that occur on Sun NIS servers when trying to broadcast
non-local addresses. The foreignness of an IPv4 address is checked using the address and mask of the interface that received the packet. If the interface address and mask are not available
(for example, when using unnumbered interfaces or when capturing packets from all addresses on Linux using a dummy interface any), this option will work
incorrect.
-F<файл> specifies the use of filters contained in the specified file. In this case, filters specified on the command line are ignored.
-i<интерфейс>
specifies the collection of packets from the specified interface. If the interface is not specified, tcpdump searches the system for a list of available interfaces and selects from it active device with minimal
number (excluding loopback).
IN Linux systems, starting with kernel 2.2, a dummy interface called any is supported, which ensures the collection of packets from all active interfaces of the system. Please note that the fee
packets from device any is carried out in normal (not promiscuous) mode.
If your system supports the -D flag, you can specify as an argument the interface number that is printed when this flag is used.
-l sets stdout line buffering. This option is useful in cases where you want to view data while collecting packets. For example, commands
tcpdump -l | tee dat
tcpdump -l > dat & tail -f dat
provide recording of packets to a dat file and simultaneous output to the console.
-L specifies the output of a list of known link layer types and termination of the program.
-m<файл> loads the SMI MIB definitions module from the specified file. This option can be used repeatedly to load multiple MIB modules.
-n disables the conversion of addresses and port numbers to symbolic names.
-N specifies the use of hostnames only, not fully qualified domain names. For example, instead of lhotze.bilim-systems.net when using this option, my work station will
denoted as lhotze.
-O disables the code optimizer for checking whether packets match filtering conditions. Use this option if you feel that the optimizer is not working properly.
-p tells the program that the interface does not need to be put into capture mode5. The -p option cannot be used in conjunction with the ether host (local-hw-addr) or ether broadcast filter.
-q specifies the output of the minimum amount of information.
-R when this flag is set, it is assumed that ESP/AH packets use old version specification6 and tcpdump will not output the replay prevention fields.
playback). Because the ESP/AH specification does not include version number fields, tcpdump cannot determine the ESP/AH protocol version from the packet headers.
-r<файл>
specifies reading data from a file previously created using the tcpdump -w command or using another program that supports the tcpdump format (for example, Ethereal). If in
The file name is set to - and the data stream from the standard input device (stdin) is used.
-S sets the output of absolute TCP sequence numbers instead of relative ones.
-s sets the capture of bytes from each snaplen packet instead of the default 68 bytes7. A value of 68 is suitable for IP, ICMP, TCP and UDP protocols but may result in loss of
protocol information for some DNS and NFS packages. The loss of some packets due to the small size of the snapshot frame is indicated in the output data by fields of the form
[|proto]’, where proto is the name of the protocol level at which part of the packet was cut off8. Note that increasing the capture frame will result in additional temporary
packet processing costs and a reduction in the number of buffered packets, which can lead to the loss of some packets. Use the minimum snaplen value that will allow
avoid losing information about the protocol you are interested in. Setting snaplen=0 will capture complete packets.
-T<тип>
sets the interpretation of packets selected using the filter as packets of the type specified by the parameter. Currently supported types are aodv9, cnfp10, rpc11, rtp12, rtcp13,
snmp14, tftp15, vat16 and wb17.
-t disables the output of timestamps in each dump line.
-tt specifies the output of unformatted timestamps on each line of the dump.
-ttt specifies the output of time intervals (in microseconds) between the previous capture and of this package in each line of the dump.
-tttt specifies the output of timestamps in the default format for each dump line.
-u sets the output of NFS handles without decoding.
-U sets the “batch-level buffering” mode for files saved using the -w option. In this mode, each packet is written to the output file as soon as it is captured
(without waiting for the output buffer to fill). The -U flag will not be supported if tcpdump was compiled with an old libpcap option that does not support the function
pcap_dump_flush().
-v specifies the output additional information when capturing files. This information may include TTL (Time to Live) value, identification, overall size, IP options, etc. When
When using this flag, additional packet integrity checks are also performed using checksums (for example, for the IP and ICMP protocols).
-vv specifies an additional increase in the volume of output information (for example, full decoding of SMB packets, output of additional NFS response fields, etc.).
-vvv sets the maximum amount of information displayed (for example, telnet options SB ... SE are displayed completely). When used in conjunction with the -X switch, Telnet options are also displayed in
hexadecimal representation.
-w<файл>
specifies recording of raw packets. Packets collected into a file can later be viewed using the -r flag or transferred to other programs for analysis
(eg Ethereal). If the file name is -, the file is written to the standard output device (stdout).
-x specifies the output of a hexadecimal dump (without the link-layer header) for each captured packet. The amount of information displayed is determined by the smaller of two values -
package size and snaplen parameter value. Note that when capturing full link layer frames, the dump may also include padding bytes if the network layer packet
has a small size.
-xx sets the output of a hexadecimal dump for each packet, including link-layer headers.
-X specifies dump output in hexadecimal and ASCII format without link-layer headers. This option can be very convenient when analyzing new protocols.
-XX specifies dump output in hexadecimal and ASCII format, including link-layer headers.
-y<тип> specifies the type of link layer used when capturing packets. Supported values can be viewed using the -L flag.
Examples.
- We catch all outgoing traffic
tcpdump -i re0 -n -nn -ttt dst host 192.168.1.2
- We catch all outgoing traffic except our ssh session because there is a very large data flow.
tcpdump -i re0 -n -nn -ttt ‘dst host 192.168.1.110 and not (src host 192.168.1.2 and dst port 22)’
- View dns communication
tcpdump -i re0 -n -nn -ttt ‘host 192.168.1.110 and port 53’
- View icmp packets
tcpdump -i re0 -n -nn -ttt ‘ip proto \icmp’
- Traffic moving from network 10.7.20 with destination on network 10.7.0. or 10.7.24.:
tcpdump -nvX src net 10.7.20.0.0/16 and dst net 10.7.0.0/8 or 10.7.24.0/16
- Traffic coming from network 10.7.0.0 to destination ports 22 or 4589:
tcpdump 'src 10.7.0.0 and (dst port 22 or 4589)'
- View traffic on the interface:
- see the traffic of one host:
tcpdump host 192.168.1.1
- View traffic on a port:
tcpdump src port 80
- View IP traffic to the host:
tcpdump ip host 192.168.1.2
- View ARP traffic to the host:
tcpdump arp host 192.168.1.2
- We look at RARP traffic to the host:
tcpdump rarp host 192.168.1.2
- We look at the traffic, except for the host pav253
tcpdump not host pav253
- We look at the traffic on pav253 and pav210
tcpdump host pav253 or host pav210
- We look at the contents of the packets on the re0 interface to the host site
tcpdump -X -i re0 host site
- icq traffic
tcpdump -X -i re0 port aol
- We look at the contents of the packets on the tun0 interface to the host ya.ru, while reading 1500 bytes from each packet and not converting the IP to the host name
tcpdump -X -s 1500 -n -i re0 host site
- Top active interactions
tcpdump -tn -c 10000 -i re0 tcp or udp | awk -F "." ‘(print $1″.”$2″.”$3″.”$4)’ | \sort | uniq -c | sort -nr | awk '$1 > 100'
- We look at all TCP packets with the SYN (session start) flag.
tcpdump -i eth0 -nn tcp == 2 and src net 192.168.1.0/24
- View syn and fin packets from outside
tcpdump 'tcp & (tcp-syn|tcp-fin) != 0 and not src and dst net 192.168.1.0'
- View all ipv4 http packets from port 80, except syn/fin/ack data
tcpdump ‘tcp port 80 and (((ip — ((ip&0xf)<>2)) != 0)’
- View only syn packages